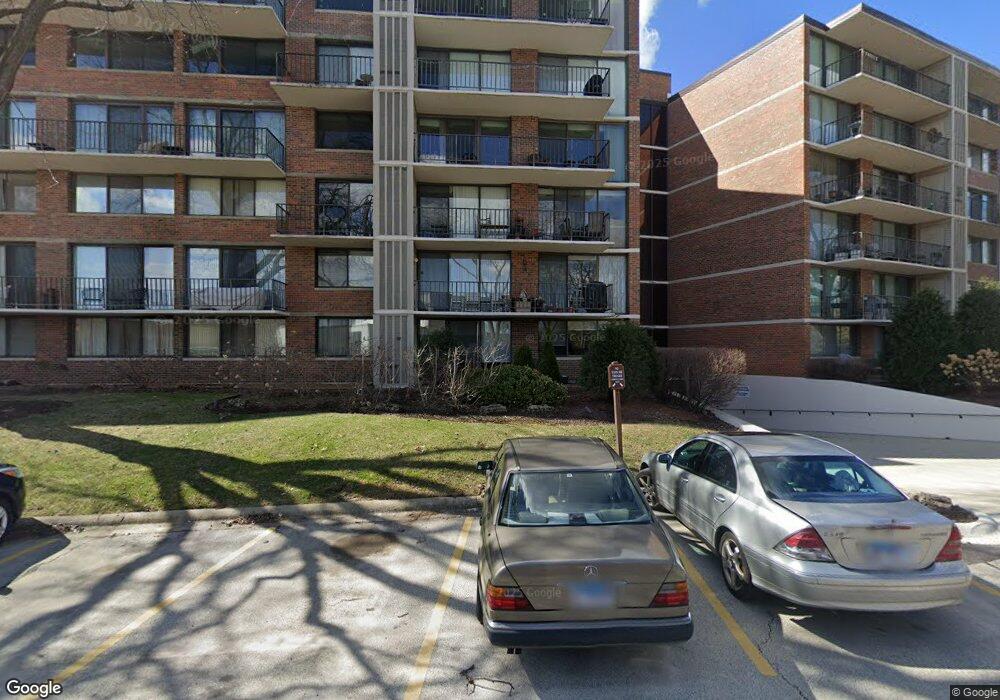
The Atrium Condominiums 2 S Atrium Way Unit 508 Elmhurst, IL 60126
Estimated Value: $258,000 - $305,000
--
Bed
--
Bath
1,204
Sq Ft
$231/Sq Ft
Est. Value
About This Home
This home is located at 2 S Atrium Way Unit 508, Elmhurst, IL 60126 and is currently estimated at $278,419, approximately $231 per square foot. 2 S Atrium Way Unit 508 is a home located in DuPage County with nearby schools including Salt Creek Elementary School, Stella May Swartz Elementary School, and John E Albright Middle School.
Ownership History
Date
Name
Owned For
Owner Type
Purchase Details
Closed on
Nov 7, 2023
Sold by
Hamilton Nancy Ann
Bought by
Aghazadeh Kathleen M
Current Estimated Value
Home Financials for this Owner
Home Financials are based on the most recent Mortgage that was taken out on this home.
Original Mortgage
$150,000
Outstanding Balance
$147,563
Interest Rate
7.87%
Mortgage Type
New Conventional
Estimated Equity
$130,856
Purchase Details
Closed on
Nov 16, 2018
Sold by
Declaration Walling Jr Myron B
Bought by
Hamilton Nancy A
Purchase Details
Closed on
Oct 14, 2004
Sold by
Walling Myron B
Bought by
Walling Myron B and The Myron B Walling Jr Declaration Of Tr
Purchase Details
Closed on
Mar 3, 1998
Sold by
Mclaughlin Robert P and Mclaughlin Dorothy E
Bought by
Walling Myron B
Create a Home Valuation Report for This Property
The Home Valuation Report is an in-depth analysis detailing your home's value as well as a comparison with similar homes in the area
Home Values in the Area
Average Home Value in this Area
Purchase History
| Date | Buyer | Sale Price | Title Company |
|---|---|---|---|
| Aghazadeh Kathleen M | $250,000 | None Listed On Document | |
| Hamilton Nancy A | -- | Chicago Title | |
| Walling Myron B | -- | -- | |
| Walling Myron B | $103,000 | -- |
Source: Public Records
Mortgage History
| Date | Status | Borrower | Loan Amount |
|---|---|---|---|
| Open | Aghazadeh Kathleen M | $150,000 |
Source: Public Records
Tax History Compared to Growth
Tax History
| Year | Tax Paid | Tax Assessment Tax Assessment Total Assessment is a certain percentage of the fair market value that is determined by local assessors to be the total taxable value of land and additions on the property. | Land | Improvement |
|---|---|---|---|---|
| 2024 | $3,816 | $78,510 | $7,851 | $70,659 |
| 2023 | $2,856 | $72,600 | $7,260 | $65,340 |
| 2022 | $2,558 | $62,540 | $6,260 | $56,280 |
| 2021 | $2,592 | $60,980 | $6,100 | $54,880 |
| 2020 | $2,817 | $59,650 | $5,970 | $53,680 |
| 2019 | $2,699 | $56,720 | $5,680 | $51,040 |
| 2018 | $2,333 | $53,690 | $5,380 | $48,310 |
| 2017 | $1,741 | $51,170 | $5,130 | $46,040 |
| 2016 | $1,747 | $48,200 | $4,830 | $43,370 |
| 2015 | $1,857 | $44,900 | $4,500 | $40,400 |
| 2014 | $1,947 | $41,750 | $4,180 | $37,570 |
| 2013 | $1,935 | $42,340 | $4,240 | $38,100 |
Source: Public Records
About The Atrium Condominiums
Map
Nearby Homes
- 2 S Atrium Way Unit 203
- 1200 S Prospect Ave Unit 303
- 1200 S Prospect Ave Unit 108
- 274 Timber View Dr
- 175 W Brush Hill Rd Unit 404
- 1S045 Spring Rd Unit 1D
- 130 Crab Apple Ln
- 995 S Swain Ave
- 1S150 Spring Rd Unit 5B
- 1S150 Spring Rd Unit 4L
- 110 W Butterfield Rd Unit 502S
- 963 S Saylor Ave
- 3 Oak Brook Club Dr Unit E207
- 936 S Mitchell Ave
- 1 Oak Brook Club Dr Unit A301
- 1 Oak Brook Club Dr Unit A312
- 911 Red Fox Ln
- 601-1 Harger Rd
- 162 E Hale St
- 814 S Saylor Ave
- 2 S Atrium Way Unit 205
- 2 S Atrium Way Unit 302
- 2 S Atrium Way Unit 409
- 2 S Atrium Way Unit 601
- 2 S Atrium Way Unit 106
- 2 S Atrium Way Unit 101
- 2 S Atrium Way Unit 410
- 2 S Atrium Way Unit 306
- 2 S Atrium Way Unit 506
- 2 S Atrium Way Unit 305
- 2 S Atrium Way Unit 210
- 2 S Atrium Way Unit 202
- 2 S Atrium Way Unit 103
- 2 S Atrium Way Unit 307
- 2 S Atrium Way Unit 105
- 2 S Atrium Way Unit 406
- 2 S Atrium Way Unit 607
- 2 S Atrium Way Unit 110
- 2 S Atrium Way Unit 303
- 2 S Atrium Way Unit 209