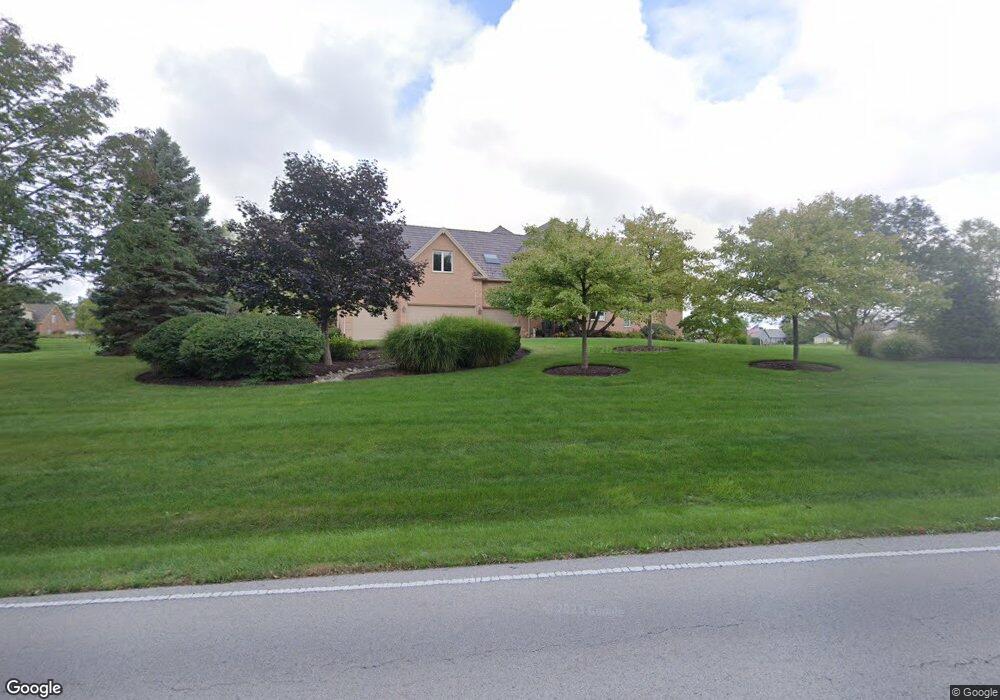
2 S Cove Dr South Barrington, IL 60010
Estimated Value: $1,664,370 - $2,347,000
5
Beds
6
Baths
7,148
Sq Ft
$266/Sq Ft
Est. Value
About This Home
This home is located at 2 S Cove Dr, South Barrington, IL 60010 and is currently estimated at $1,898,343, approximately $265 per square foot. 2 S Cove Dr is a home located in Cook County with nearby schools including Barbara B. Rose Elementary School, Barrington Middle School Station Campus, and Barrington High School.
Ownership History
Date
Name
Owned For
Owner Type
Purchase Details
Closed on
Aug 16, 2024
Sold by
Linda M Riley Qualified Personal Residen and Riley Linda M
Bought by
Riley Christopher P and Riley Kevin D
Current Estimated Value
Purchase Details
Closed on
Apr 20, 1999
Sold by
Harris Bank Barrington
Bought by
Riley David and Riley Linda
Home Financials for this Owner
Home Financials are based on the most recent Mortgage that was taken out on this home.
Original Mortgage
$540,000
Interest Rate
6.99%
Create a Home Valuation Report for This Property
The Home Valuation Report is an in-depth analysis detailing your home's value as well as a comparison with similar homes in the area
Home Values in the Area
Average Home Value in this Area
Purchase History
| Date | Buyer | Sale Price | Title Company |
|---|---|---|---|
| Riley Christopher P | -- | None Listed On Document | |
| Riley David | $932,500 | -- |
Source: Public Records
Mortgage History
| Date | Status | Borrower | Loan Amount |
|---|---|---|---|
| Previous Owner | Riley David | $540,000 |
Source: Public Records
Tax History Compared to Growth
Tax History
| Year | Tax Paid | Tax Assessment Tax Assessment Total Assessment is a certain percentage of the fair market value that is determined by local assessors to be the total taxable value of land and additions on the property. | Land | Improvement |
|---|---|---|---|---|
| 2024 | $27,884 | $129,001 | $25,568 | $103,433 |
| 2023 | $27,066 | $129,001 | $25,568 | $103,433 |
| 2022 | $27,066 | $129,001 | $25,568 | $103,433 |
| 2021 | $26,755 | $113,543 | $17,045 | $96,498 |
| 2020 | $26,971 | $117,564 | $17,045 | $100,519 |
| 2019 | $26,336 | $130,627 | $17,045 | $113,582 |
| 2018 | $27,157 | $124,707 | $14,914 | $109,793 |
| 2017 | $25,141 | $124,707 | $14,914 | $109,793 |
| 2016 | $24,915 | $124,707 | $14,914 | $109,793 |
| 2015 | $24,225 | $116,643 | $12,783 | $103,860 |
| 2014 | $25,053 | $116,643 | $12,783 | $103,860 |
| 2013 | $23,931 | $116,643 | $12,783 | $103,860 |
Source: Public Records
Map
Nearby Homes