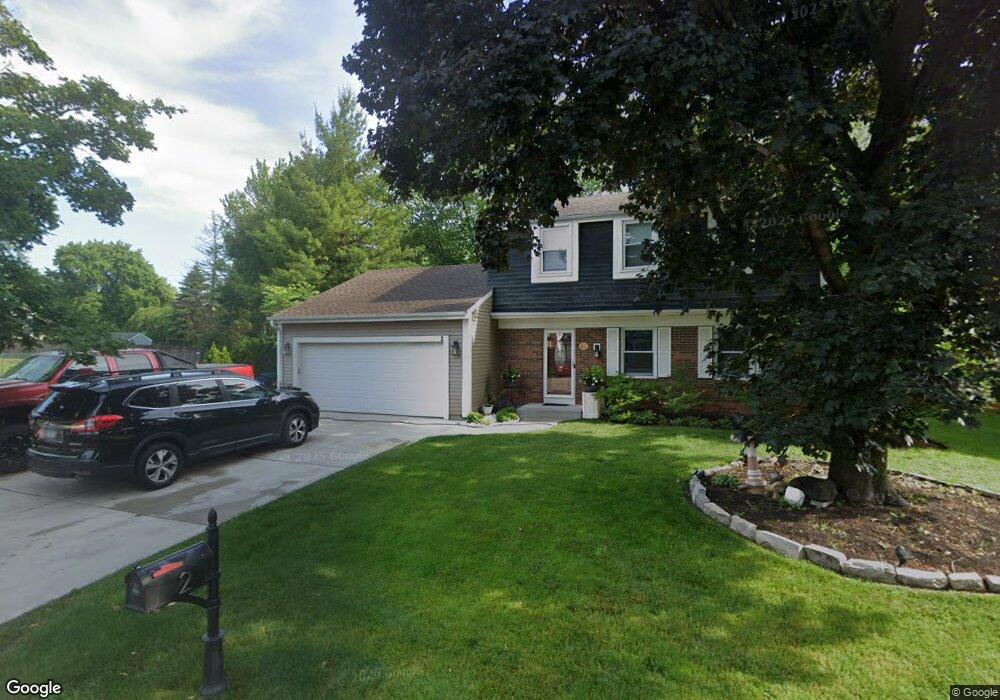
2 Saint Ives Ln Vernon Hills, IL 60061
Estimated Value: $471,000 - $517,000
3
Beds
3
Baths
1,900
Sq Ft
$255/Sq Ft
Est. Value
About This Home
This home is located at 2 Saint Ives Ln, Vernon Hills, IL 60061 and is currently estimated at $484,669, approximately $255 per square foot. 2 Saint Ives Ln is a home located in Lake County with nearby schools including Hawthorn Aspen Elementary School, Hawthorn School Of Dual Language, and Hawthorn Middle School South.
Ownership History
Date
Name
Owned For
Owner Type
Purchase Details
Closed on
Dec 6, 2012
Sold by
Pasillas Oliverio and Quinonez Oivia
Bought by
Pasillas Oliverio and Quinonez Olivia
Current Estimated Value
Home Financials for this Owner
Home Financials are based on the most recent Mortgage that was taken out on this home.
Original Mortgage
$200,000
Outstanding Balance
$138,371
Interest Rate
3.34%
Mortgage Type
New Conventional
Estimated Equity
$346,298
Purchase Details
Closed on
Nov 28, 2011
Sold by
Doerhoefer Donald E and Edward J Doerhoefer Trust
Bought by
Pasillias Oliverio and Quinonez Olivia
Home Financials for this Owner
Home Financials are based on the most recent Mortgage that was taken out on this home.
Original Mortgage
$200,000
Interest Rate
4.11%
Mortgage Type
New Conventional
Purchase Details
Closed on
Nov 30, 1999
Sold by
Doerhoefer Edward J and Doerhoefer Lorraine E
Bought by
Doerhoefer Edward J and Edward J Doerhoefer Trust
Create a Home Valuation Report for This Property
The Home Valuation Report is an in-depth analysis detailing your home's value as well as a comparison with similar homes in the area
Home Values in the Area
Average Home Value in this Area
Purchase History
| Date | Buyer | Sale Price | Title Company |
|---|---|---|---|
| Pasillas Oliverio | -- | Fidelity National Title | |
| Pasillias Oliverio | $250,000 | Stewart Title Company | |
| Doerhoefer Edward J | -- | -- |
Source: Public Records
Mortgage History
| Date | Status | Borrower | Loan Amount |
|---|---|---|---|
| Open | Pasillas Oliverio | $200,000 | |
| Closed | Pasillias Oliverio | $200,000 |
Source: Public Records
Tax History Compared to Growth
Tax History
| Year | Tax Paid | Tax Assessment Tax Assessment Total Assessment is a certain percentage of the fair market value that is determined by local assessors to be the total taxable value of land and additions on the property. | Land | Improvement |
|---|---|---|---|---|
| 2024 | $9,705 | $118,550 | $23,219 | $95,331 |
| 2023 | $9,313 | $111,861 | $21,909 | $89,952 |
| 2022 | $9,313 | $106,121 | $20,785 | $85,336 |
| 2021 | $9,012 | $104,977 | $20,561 | $84,416 |
| 2020 | $8,873 | $105,335 | $20,631 | $84,704 |
| 2019 | $8,656 | $104,947 | $20,555 | $84,392 |
| 2018 | $7,985 | $98,454 | $20,316 | $78,138 |
| 2017 | $7,898 | $96,156 | $19,842 | $76,314 |
| 2016 | $7,652 | $92,077 | $19,000 | $73,077 |
| 2015 | $7,564 | $85,963 | $17,769 | $68,194 |
| 2014 | $7,483 | $83,793 | $19,084 | $64,709 |
| 2012 | $7,340 | $83,961 | $19,122 | $64,839 |
Source: Public Records
Map
Nearby Homes
- 124 Midway Ln
- 219 Abilene Ln
- 221 Alexandria Dr
- 116 S Deerpath Dr
- 14 Edgewood Rd
- 128 Lilly Ct
- 100 Lilly Ct
- 15 Tanwood Ct Unit 52B
- 361 Ashwood Ct Unit 75D
- 382 Birchwood Ct Unit 82C
- 336 Westwood Ct Unit 42D
- 307 Albright Ct
- 233 Harvest Ct
- 414 Briarwood Ct Unit 1D
- 190 Southgate Dr
- 215 Sunset Ct Unit 4102
- 306 Lasalle St
- 234 Us Highway 45
- 339 Lasalle St
- 717 Summit Ln
- 4 Saint Ives Ln
- 1 Keswick St
- 3 Saint Ives Ln
- 3 Keswick St
- 9 Saint Ives Ln
- 6 Saint Ives Ln
- 1 Saint Ives Ln
- 109 Annapolis Dr
- 101 Asheville Ct
- 107 Annapolis Dr
- 100 Asheville Ct
- 13 Saint Ives Ln
- 6 Malvern Ln Unit 3
- 8 Saint Ives Ln
- 2 Keswick St
- 111 Annapolis Dr
- 10 Saint Ives Ln
- 7 Keswick St
- 2 Malvern Ln
- 4 Keswick St