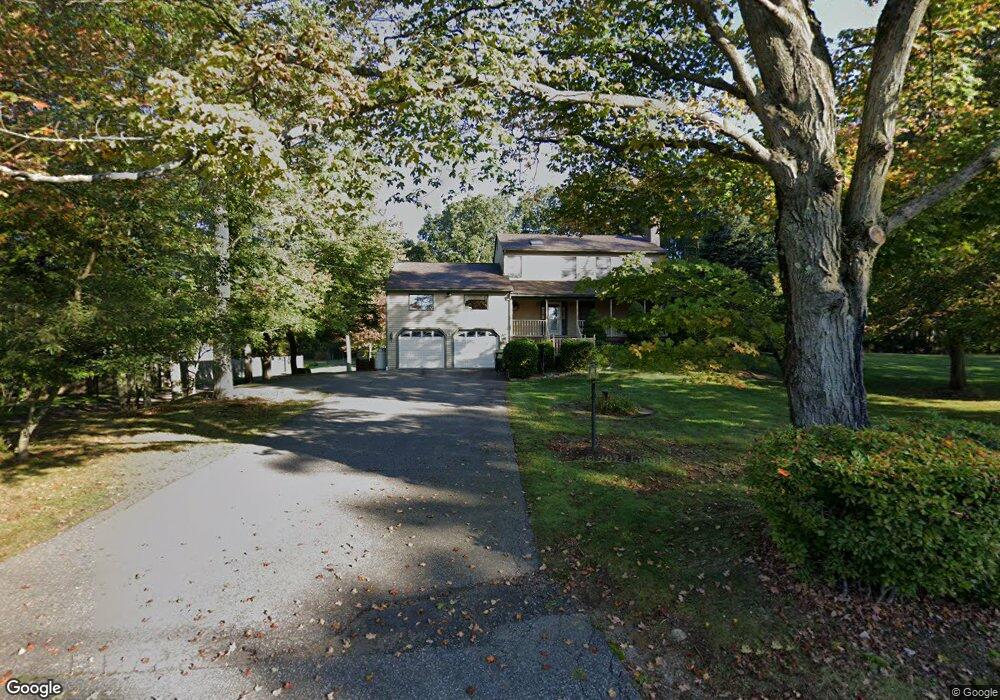
2 Salem Rd Prospect, CT 06712
Estimated Value: $394,000 - $586,000
3
Beds
3
Baths
2,662
Sq Ft
$189/Sq Ft
Est. Value
About This Home
This home is located at 2 Salem Rd, Prospect, CT 06712 and is currently estimated at $501,802, approximately $188 per square foot. 2 Salem Rd is a home located in New Haven County with nearby schools including Prospect Elementary School, Long River Middle School, and Woodland Regional High School.
Ownership History
Date
Name
Owned For
Owner Type
Purchase Details
Closed on
Nov 19, 1996
Sold by
Brown Robert P
Bought by
Lebrun Linda
Current Estimated Value
Create a Home Valuation Report for This Property
The Home Valuation Report is an in-depth analysis detailing your home's value as well as a comparison with similar homes in the area
Home Values in the Area
Average Home Value in this Area
Purchase History
| Date | Buyer | Sale Price | Title Company |
|---|---|---|---|
| Lebrun Linda | $205,000 | -- |
Source: Public Records
Mortgage History
| Date | Status | Borrower | Loan Amount |
|---|---|---|---|
| Open | Lebrun Linda | $34,000 | |
| Closed | Lebrun Linda | $170,000 | |
| Previous Owner | Lebrun Linda | $30,000 |
Source: Public Records
Tax History
| Year | Tax Paid | Tax Assessment Tax Assessment Total Assessment is a certain percentage of the fair market value that is determined by local assessors to be the total taxable value of land and additions on the property. | Land | Improvement |
|---|---|---|---|---|
| 2025 | $7,425 | $290,360 | $81,200 | $209,160 |
| 2024 | $6,426 | $199,950 | $81,210 | $118,740 |
| 2023 | $6,382 | $199,950 | $81,210 | $118,740 |
| 2022 | $6,388 | $199,950 | $81,210 | $118,740 |
| 2021 | $6,458 | $199,950 | $81,210 | $118,740 |
| 2020 | $6,453 | $204,200 | $81,210 | $122,990 |
| 2019 | $6,320 | $204,200 | $81,210 | $122,990 |
| 2018 | $6,330 | $204,200 | $81,210 | $122,990 |
| 2017 | $6,381 | $204,200 | $81,210 | $122,990 |
| 2016 | $6,108 | $204,200 | $81,210 | $122,990 |
| 2015 | $5,903 | $201,960 | $81,210 | $120,750 |
| 2014 | $5,853 | $201,960 | $81,210 | $120,750 |
Source: Public Records
Map
Nearby Homes
- 20 Hydelor Ave
- 66 Union City Rd
- 6 Laura Ave
- 6 Holley Ln
- 44 Cheshire Rd
- 9 Melissa Ln
- 24 Rozum Cir
- 4 Alison Ct
- 125 Salem Rd
- 9 Cheryl Ln
- 26 Geraldine Dr
- 17 White Oak Dr Unit 17
- 6 Saunders Ln
- 50 Lilac Ln Unit 50
- 73 Warm Earth Rd
- 57 Warm Earth Rd
- 21 Longwood Dr
- 43 Warm Earth Rd
- 56 Morning Mist Rd
- 31 Warm Earth Rd
Your Personal Tour Guide
Ask me questions while you tour the home.