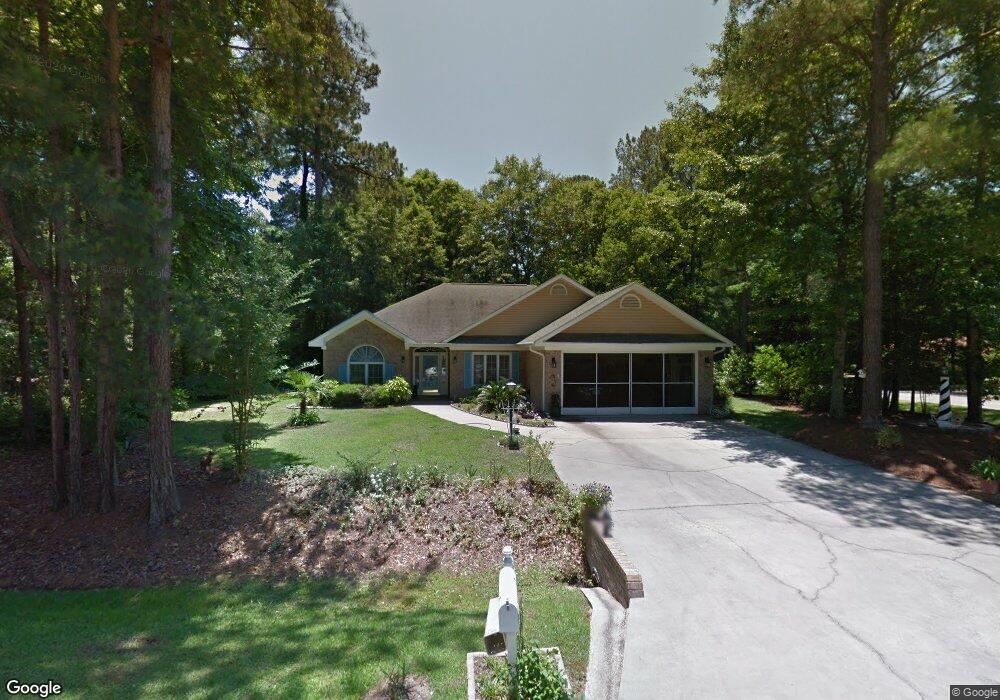
2 Sanddollar Ct Carolina Shores, NC 28467
Estimated Value: $329,196 - $354,000
3
Beds
2
Baths
1,930
Sq Ft
$177/Sq Ft
Est. Value
About This Home
This home is located at 2 Sanddollar Ct, Carolina Shores, NC 28467 and is currently estimated at $341,549, approximately $176 per square foot. 2 Sanddollar Ct is a home located in Brunswick County with nearby schools including Jessie Mae Monroe Elementary School, Shallotte Middle School, and West Brunswick High School.
Ownership History
Date
Name
Owned For
Owner Type
Purchase Details
Closed on
Aug 15, 2022
Sold by
Shaw Karl E and Shaw Julie E
Bought by
Phipps Clifford Bryon and Phipps Kimberly
Current Estimated Value
Home Financials for this Owner
Home Financials are based on the most recent Mortgage that was taken out on this home.
Original Mortgage
$341,880
Outstanding Balance
$326,932
Interest Rate
5.54%
Mortgage Type
VA
Estimated Equity
$14,617
Purchase Details
Closed on
Oct 13, 2021
Sold by
Shaw Karl E and Shaw Julie E
Bought by
Shaw Karl E and Shaw Julie E
Home Financials for this Owner
Home Financials are based on the most recent Mortgage that was taken out on this home.
Original Mortgage
$200,000
Interest Rate
2.1%
Mortgage Type
New Conventional
Purchase Details
Closed on
Aug 1, 2002
Bought by
Shaw Karl E
Create a Home Valuation Report for This Property
The Home Valuation Report is an in-depth analysis detailing your home's value as well as a comparison with similar homes in the area
Home Values in the Area
Average Home Value in this Area
Purchase History
| Date | Buyer | Sale Price | Title Company |
|---|---|---|---|
| Phipps Clifford Bryon | $330,000 | Webster Law Firm Pc | |
| Shaw Karl E | -- | Westcor Land Title Ins Co | |
| Shaw Karl E | $150,000 | -- |
Source: Public Records
Mortgage History
| Date | Status | Borrower | Loan Amount |
|---|---|---|---|
| Open | Phipps Clifford Bryon | $341,880 | |
| Previous Owner | Shaw Karl E | $200,000 |
Source: Public Records
Tax History Compared to Growth
Tax History
| Year | Tax Paid | Tax Assessment Tax Assessment Total Assessment is a certain percentage of the fair market value that is determined by local assessors to be the total taxable value of land and additions on the property. | Land | Improvement |
|---|---|---|---|---|
| 2025 | $1,612 | $319,360 | $29,000 | $290,360 |
| 2024 | $1,612 | $319,360 | $29,000 | $290,360 |
| 2023 | $1,341 | $319,360 | $29,000 | $290,360 |
| 2022 | $1,341 | $194,560 | $25,000 | $169,560 |
| 2021 | $1,341 | $194,560 | $25,000 | $169,560 |
| 2020 | $1,298 | $194,560 | $25,000 | $169,560 |
| 2019 | $1,298 | $26,430 | $25,000 | $1,430 |
| 2018 | $1,120 | $21,930 | $20,000 | $1,930 |
| 2017 | $1,120 | $21,930 | $20,000 | $1,930 |
| 2016 | $1,095 | $21,930 | $20,000 | $1,930 |
| 2015 | $1,095 | $169,690 | $20,000 | $149,690 |
| 2014 | $1,072 | $178,616 | $35,000 | $143,616 |
Source: Public Records
Map
Nearby Homes
- 9 Sand Dollar Dr
- 7 Sand Dollar Ct
- 98 Calabash Dr
- 481 Deer Path
- 25 Pinewood Dr
- 411 Deer Path
- 21 Carolina Shores Pkwy
- 3 Brassie Dr
- 1238 Calabash Station Blvd NW
- 1159 Forest Bend Dr NW
- 1041 Rosefield Way NW
- 1259 Calabash Station Blvd NW
- 1214 Calabash Station Blvd NW
- 1246 Calabash Station Blvd NW
- 1230 Calabash Station Blvd NW
- 1155 Forest Bend Dr NW
- 1105 Forest Bend Dr NW
- 1045 Rosefield Way NW Unit Lot 38
- 1263 Calabash Station Blvd NW
- 1255 Calabash Station Blvd NW
- 2 Sand Dollar Ct
- 15 Sanddollar Dr
- 4 Sanddollar Ct
- 1 Sanddollar Ct
- 8 Sanddollar Dr
- 8 Sanddollar Dr Unit Carolina Shores
- 5 Sanddollar Ct
- 5 Sand Dollar Ct
- 17 Sanddollar Dr
- 3 Sand Dollar Ct
- 6 Sand Dollar Dr
- 3 Sanddollar Ct
- 6 Sanddollar Dr
- 6 Sanddollar Ct
- 10 Sanddollar Dr
- 10 Sand Dollar Dr
- 7 Sanddollar Ct
- 4 Sanddollar Dr
- 9 Sanddollar Dr
- 8 Sanddollar Ct