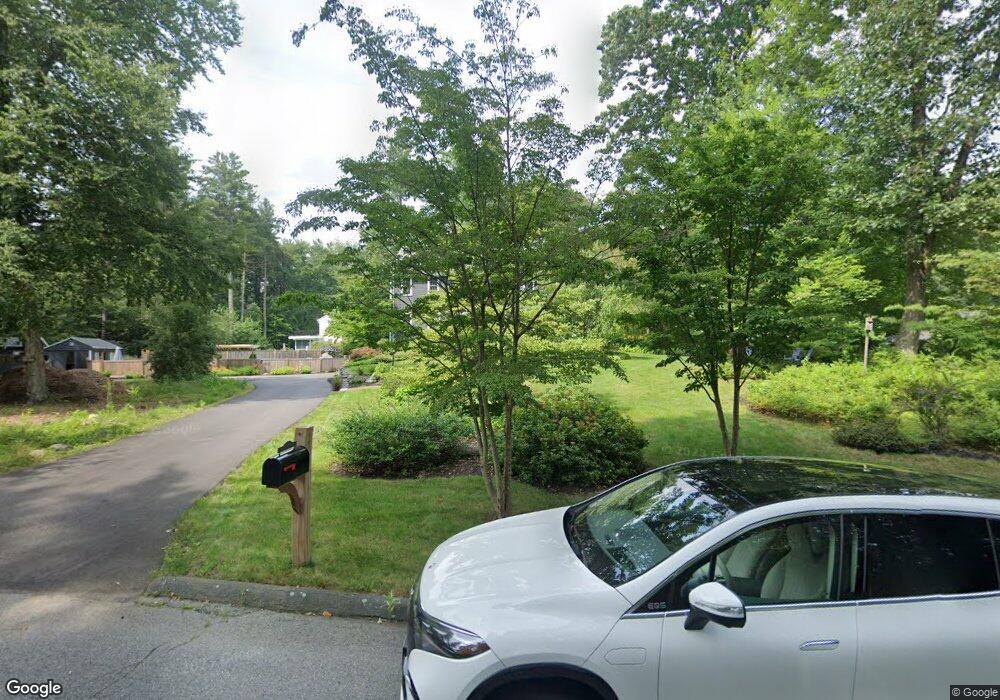
2 Scott Ln Northborough, MA 01532
Estimated Value: $793,000 - $848,207
4
Beds
4
Baths
2,375
Sq Ft
$347/Sq Ft
Est. Value
About This Home
This home is located at 2 Scott Ln, Northborough, MA 01532 and is currently estimated at $825,302, approximately $347 per square foot. 2 Scott Ln is a home located in Worcester County with nearby schools including Marion E. Zeh Elementary School, Robert E. Melican Middle School, and Algonquin Regional High School.
Ownership History
Date
Name
Owned For
Owner Type
Purchase Details
Closed on
Mar 31, 2006
Sold by
Capezio Marie and Capezio Peter J
Bought by
Ahrabi-Nejad Arman and Ahrabi-Nejad Nancy
Current Estimated Value
Home Financials for this Owner
Home Financials are based on the most recent Mortgage that was taken out on this home.
Original Mortgage
$350,000
Interest Rate
6.32%
Mortgage Type
Purchase Money Mortgage
Purchase Details
Closed on
Jul 7, 2000
Sold by
Laflash Sandra
Bought by
Kosewski Peter and Kosewski Elaine
Purchase Details
Closed on
Jun 27, 1997
Sold by
Maclean Kenneth J and Maclean Sara M
Bought by
Capezio Peter J and Capezio Marie
Purchase Details
Closed on
Aug 18, 1992
Sold by
Kominz David R
Bought by
Maclean Kenneth J and Maclean Sara
Create a Home Valuation Report for This Property
The Home Valuation Report is an in-depth analysis detailing your home's value as well as a comparison with similar homes in the area
Home Values in the Area
Average Home Value in this Area
Purchase History
| Date | Buyer | Sale Price | Title Company |
|---|---|---|---|
| Ahrabi-Nejad Arman | $529,900 | -- | |
| Kosewski Peter | $235,000 | -- | |
| Capezio Peter J | $270,000 | -- | |
| Maclean Kenneth J | $225,000 | -- |
Source: Public Records
Mortgage History
| Date | Status | Borrower | Loan Amount |
|---|---|---|---|
| Open | Maclean Kenneth J | $340,000 | |
| Closed | Ahrabi-Nejad Arman | $350,000 | |
| Previous Owner | Maclean Kenneth J | $372,000 | |
| Previous Owner | Maclean Kenneth J | $90,000 |
Source: Public Records
Tax History
| Year | Tax Paid | Tax Assessment Tax Assessment Total Assessment is a certain percentage of the fair market value that is determined by local assessors to be the total taxable value of land and additions on the property. | Land | Improvement |
|---|---|---|---|---|
| 2025 | $11,116 | $780,100 | $315,300 | $464,800 |
| 2024 | $9,905 | $693,600 | $251,700 | $441,900 |
| 2023 | $9,191 | $621,400 | $237,300 | $384,100 |
| 2022 | $8,868 | $537,800 | $226,100 | $311,700 |
| 2021 | $8,524 | $497,900 | $205,700 | $292,200 |
| 2020 | $8,494 | $492,400 | $194,100 | $298,300 |
| 2019 | $8,230 | $479,900 | $188,500 | $291,400 |
| 2018 | $7,511 | $431,900 | $183,700 | $248,200 |
| 2017 | $7,758 | $446,100 | $205,300 | $240,800 |
| 2016 | $7,660 | $446,100 | $205,300 | $240,800 |
| 2015 | $7,530 | $450,100 | $225,700 | $224,400 |
| 2014 | $7,250 | $437,000 | $225,700 | $211,300 |
Source: Public Records
Map
Nearby Homes
Your Personal Tour Guide
Ask me questions while you tour the home.