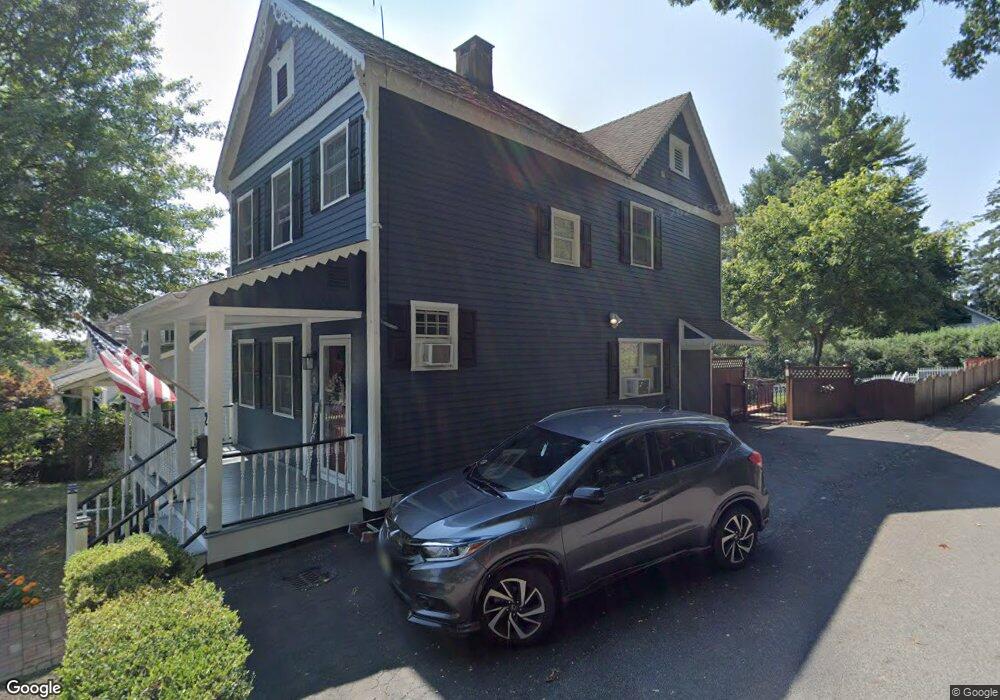
2 Seal St High Bridge, NJ 08829
Estimated Value: $405,000 - $558,000
--
Bed
--
Bath
1,432
Sq Ft
$317/Sq Ft
Est. Value
About This Home
This home is located at 2 Seal St, High Bridge, NJ 08829 and is currently estimated at $453,650, approximately $316 per square foot. 2 Seal St is a home located in Hunterdon County with nearby schools including High Bridge Elementary School, High Bridge Middle School, and Voorhees High School.
Ownership History
Date
Name
Owned For
Owner Type
Purchase Details
Closed on
Jun 21, 2002
Sold by
Flanders Paul
Bought by
Mick Robyn E
Current Estimated Value
Home Financials for this Owner
Home Financials are based on the most recent Mortgage that was taken out on this home.
Original Mortgage
$152,000
Outstanding Balance
$64,768
Interest Rate
6.92%
Estimated Equity
$388,882
Purchase Details
Closed on
Aug 1, 2000
Sold by
Tinnes Michael E
Bought by
Flanders Paul and Flanders Jennifer
Home Financials for this Owner
Home Financials are based on the most recent Mortgage that was taken out on this home.
Original Mortgage
$169,320
Interest Rate
8.1%
Mortgage Type
VA
Purchase Details
Closed on
Jul 30, 1996
Sold by
Tinnes Michael E and Tinnes Veronica V
Bought by
Tinnes Michael E
Purchase Details
Closed on
Apr 24, 1991
Sold by
Hildabrantest Of Florence E
Bought by
Tinnes Michael E and Tinnes Valerie M
Create a Home Valuation Report for This Property
The Home Valuation Report is an in-depth analysis detailing your home's value as well as a comparison with similar homes in the area
Home Values in the Area
Average Home Value in this Area
Purchase History
| Date | Buyer | Sale Price | Title Company |
|---|---|---|---|
| Mick Robyn E | $190,000 | -- | |
| Flanders Paul | $166,000 | -- | |
| Tinnes Michael E | -- | -- | |
| Tinnes Michael E | $92,800 | -- |
Source: Public Records
Mortgage History
| Date | Status | Borrower | Loan Amount |
|---|---|---|---|
| Open | Mick Robyn E | $152,000 | |
| Previous Owner | Flanders Paul | $169,320 |
Source: Public Records
Tax History Compared to Growth
Tax History
| Year | Tax Paid | Tax Assessment Tax Assessment Total Assessment is a certain percentage of the fair market value that is determined by local assessors to be the total taxable value of land and additions on the property. | Land | Improvement |
|---|---|---|---|---|
| 2025 | $14,071 | $388,300 | $136,300 | $252,000 |
| 2024 | $11,633 | $431,100 | $113,200 | $317,900 |
| 2023 | $11,633 | $294,200 | $112,500 | $181,700 |
| 2022 | $9,663 | $227,100 | $90,800 | $136,300 |
| 2021 | $9,365 | $226,500 | $90,800 | $135,700 |
| 2020 | $9,295 | $226,700 | $91,000 | $135,700 |
| 2019 | $9,365 | $226,700 | $91,000 | $135,700 |
| 2018 | $8,885 | $224,200 | $88,500 | $135,700 |
| 2017 | $8,093 | $210,000 | $74,300 | $135,700 |
| 2016 | $7,999 | $210,000 | $74,300 | $135,700 |
| 2015 | $7,783 | $210,000 | $74,300 | $135,700 |
| 2014 | $7,479 | $218,100 | $93,400 | $124,700 |
Source: Public Records
Map
Nearby Homes