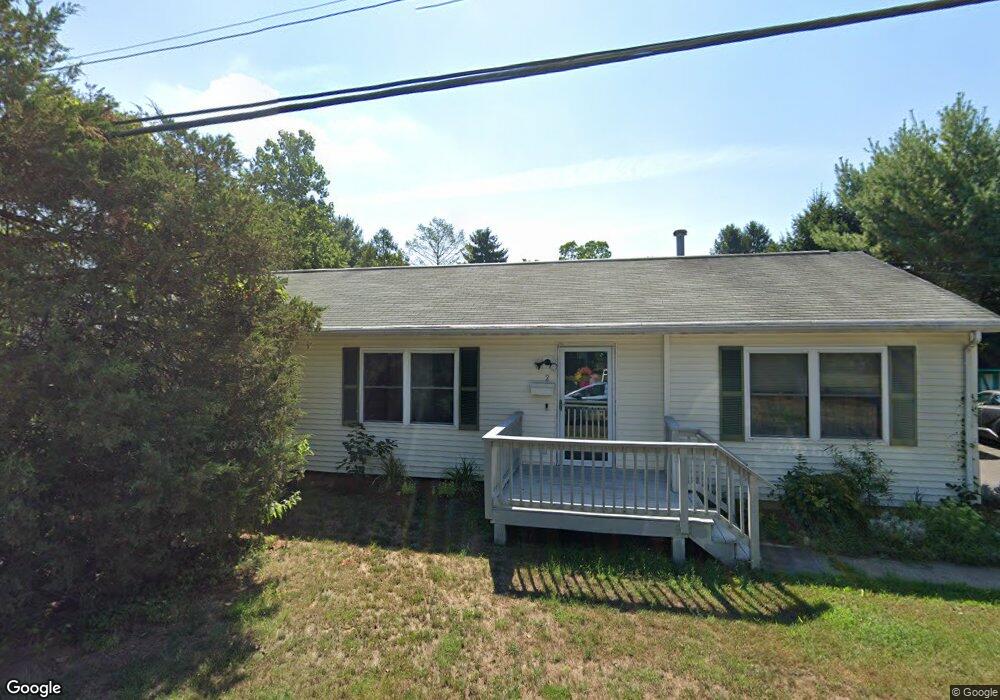
2 Shady Ln Pemberton, NJ 08068
Estimated Value: $310,686 - $401,000
Studio
--
Bath
1,352
Sq Ft
$259/Sq Ft
Est. Value
About This Home
This home is located at 2 Shady Ln, Pemberton, NJ 08068 and is currently estimated at $350,672, approximately $259 per square foot. 2 Shady Ln is a home located in Burlington County.
Ownership History
Date
Name
Owned For
Owner Type
Purchase Details
Closed on
Apr 23, 1996
Sold by
Rosario Fernando
Bought by
Rosario Fernando and Rosario Nilly
Current Estimated Value
Purchase Details
Closed on
Apr 4, 1996
Sold by
M & R Contractors Inc
Bought by
Rosario Fernando
Purchase Details
Closed on
Mar 8, 1995
Sold by
Doty Taylor and Doty Patricia
Bought by
Buchanan Ronald and Buchanan Bettie
Create a Home Valuation Report for This Property
The Home Valuation Report is an in-depth analysis detailing your home's value as well as a comparison with similar homes in the area
Home Values in the Area
Average Home Value in this Area
Purchase History
| Date | Buyer | Sale Price | Title Company |
|---|---|---|---|
| Rosario Fernando | -- | -- | |
| Rosario Fernando | $99,900 | Surety Title Corporation | |
| M & R Contractors Inc | -- | Surety Title Corporation | |
| Buchanan Ronald | $8,000 | Continental Title Insurance |
Source: Public Records
Tax History
| Year | Tax Paid | Tax Assessment Tax Assessment Total Assessment is a certain percentage of the fair market value that is determined by local assessors to be the total taxable value of land and additions on the property. | Land | Improvement |
|---|---|---|---|---|
| 2025 | $5,428 | $177,100 | $36,500 | $140,600 |
| 2024 | $5,093 | $177,100 | $36,500 | $140,600 |
| 2023 | $5,093 | $177,100 | $36,500 | $140,600 |
| 2022 | $4,714 | $177,100 | $36,500 | $140,600 |
| 2021 | $4,521 | $177,100 | $36,500 | $140,600 |
| 2020 | $4,351 | $177,100 | $36,500 | $140,600 |
| 2019 | $4,167 | $177,100 | $36,500 | $140,600 |
| 2018 | $4,025 | $177,100 | $36,500 | $140,600 |
| 2017 | $3,942 | $177,100 | $36,500 | $140,600 |
| 2016 | $3,443 | $92,100 | $12,800 | $79,300 |
| 2015 | $3,415 | $92,100 | $12,800 | $79,300 |
| 2014 | $3,265 | $92,100 | $12,800 | $79,300 |
Source: Public Records
Map
Nearby Homes
- 26 Magnolia Rd
- 15 Estate Rd
- 0 Pemberton Vincentown Rd
- 26 Nicholas St
- 135 Hanover St
- 109 Oak Pines Blvd
- 120 Hanover St
- 922 Pembrown Rd
- 237 Princeton Ave
- 161 Kinsley Rd
- 147 Lemmon Ave
- 163 Kinsley Rd
- 162 Kinsley Rd
- 164 Kinsley Rd
- 54 Hanover St
- 246 Colgate Ave
- 448 Cornell Ave
- 244 Princeton Ave
- 100 Pin Oak Dr
- 185 Kinsley Rd
Your Personal Tour Guide
Ask me questions while you tour the home.