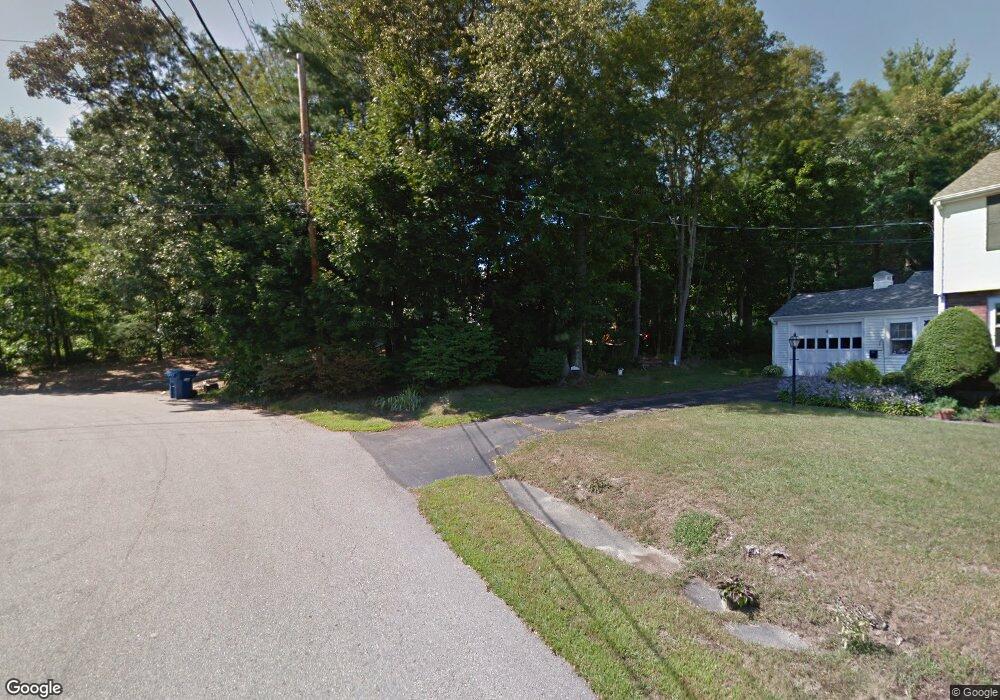
2 Sherman Rd Millis, MA 02054
Estimated Value: $595,000 - $727,000
3
Beds
2
Baths
1,523
Sq Ft
$437/Sq Ft
Est. Value
About This Home
This home is located at 2 Sherman Rd, Millis, MA 02054 and is currently estimated at $665,905, approximately $437 per square foot. 2 Sherman Rd is a home located in Norfolk County with nearby schools including Clyde F Brown, Millis Middle School, and Millis High School.
Ownership History
Date
Name
Owned For
Owner Type
Purchase Details
Closed on
Apr 29, 2005
Sold by
Roches Building Co Llc
Bought by
Morgan 3Rd Paul
Current Estimated Value
Home Financials for this Owner
Home Financials are based on the most recent Mortgage that was taken out on this home.
Original Mortgage
$285,600
Outstanding Balance
$149,965
Interest Rate
5.95%
Estimated Equity
$515,940
Purchase Details
Closed on
Sep 16, 2004
Sold by
Chloe Ehart T
Bought by
Roches Bldg Co Inc
Home Financials for this Owner
Home Financials are based on the most recent Mortgage that was taken out on this home.
Original Mortgage
$210,000
Interest Rate
6.02%
Mortgage Type
Purchase Money Mortgage
Create a Home Valuation Report for This Property
The Home Valuation Report is an in-depth analysis detailing your home's value as well as a comparison with similar homes in the area
Home Values in the Area
Average Home Value in this Area
Purchase History
| Date | Buyer | Sale Price | Title Company |
|---|---|---|---|
| Morgan 3Rd Paul | $357,000 | -- | |
| Roches Bldg Co Inc | $300,000 | -- |
Source: Public Records
Mortgage History
| Date | Status | Borrower | Loan Amount |
|---|---|---|---|
| Open | Morgan 3Rd Paul | $285,600 | |
| Previous Owner | Morgan 3Rd Paul | $250,000 | |
| Previous Owner | Roches Bldg Co Inc | $210,000 |
Source: Public Records
Tax History
| Year | Tax Paid | Tax Assessment Tax Assessment Total Assessment is a certain percentage of the fair market value that is determined by local assessors to be the total taxable value of land and additions on the property. | Land | Improvement |
|---|---|---|---|---|
| 2025 | $10,193 | $621,500 | $241,500 | $380,000 |
| 2024 | $9,391 | $571,900 | $223,000 | $348,900 |
| 2023 | $8,804 | $503,400 | $177,700 | $325,700 |
| 2022 | $8,906 | $471,700 | $190,700 | $281,000 |
| 2021 | $8,182 | $417,000 | $164,800 | $252,200 |
| 2020 | $8,445 | $419,300 | $154,000 | $265,300 |
| 2019 | $7,368 | $394,000 | $141,900 | $252,100 |
| 2018 | $6,781 | $376,300 | $141,900 | $234,400 |
| 2017 | $6,069 | $329,500 | $123,500 | $206,000 |
| 2016 | $5,746 | $329,500 | $123,500 | $206,000 |
| 2015 | $5,602 | $329,500 | $123,500 | $206,000 |
Source: Public Records
Map
Nearby Homes
Your Personal Tour Guide
Ask me questions while you tour the home.