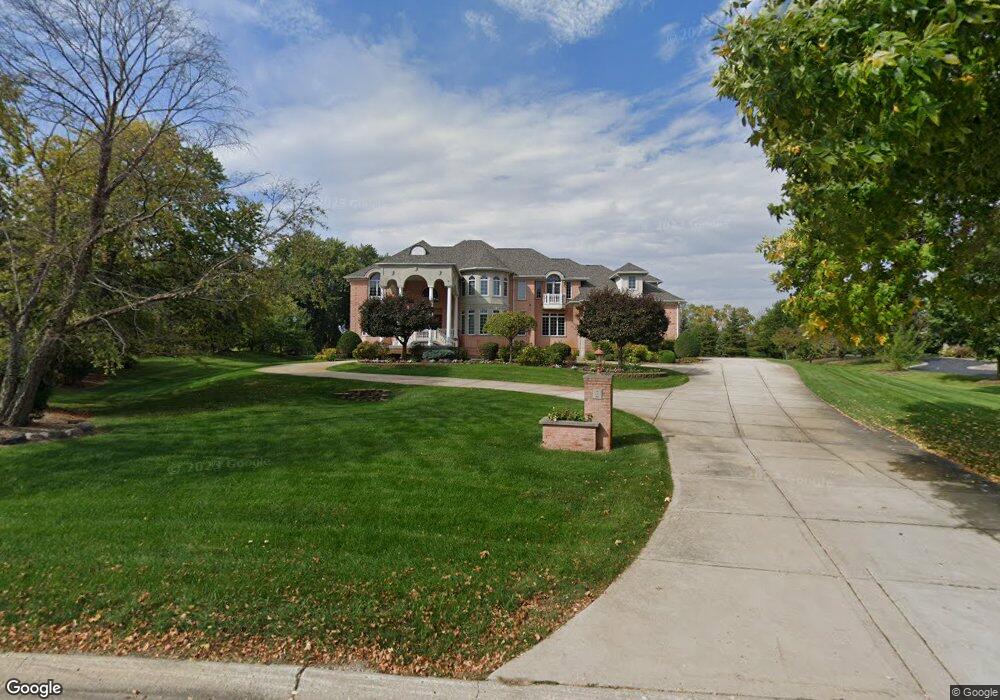
2 Spring Creek Dr South Barrington, IL 60010
Estimated Value: $1,341,000 - $1,744,000
5
Beds
5
Baths
5,396
Sq Ft
$276/Sq Ft
Est. Value
About This Home
This home is located at 2 Spring Creek Dr, South Barrington, IL 60010 and is currently estimated at $1,489,068, approximately $275 per square foot. 2 Spring Creek Dr is a home located in Cook County with nearby schools including Barbara B. Rose Elementary School, Barrington Mdle School- Prairie Cmps, and Barrington High School.
Ownership History
Date
Name
Owned For
Owner Type
Purchase Details
Closed on
Jun 17, 2011
Sold by
Hasan Kamran and Hasan Aliya
Bought by
Hasan Kamran and Hasan Aliya
Current Estimated Value
Purchase Details
Closed on
Nov 29, 1999
Sold by
Elias Naim J and Elias Cristina
Bought by
Hasan Kamran and Hasan Aliya
Purchase Details
Closed on
Oct 1, 1998
Sold by
American National Bk & Tr Co Of Chicago
Bought by
Elias Niam J and Elias Cristina
Purchase Details
Closed on
Jul 22, 1994
Sold by
First Colonial Bank Northwest
Bought by
American National Bk & Tr Co Of Chicago
Home Financials for this Owner
Home Financials are based on the most recent Mortgage that was taken out on this home.
Original Mortgage
$77,500
Interest Rate
8.53%
Create a Home Valuation Report for This Property
The Home Valuation Report is an in-depth analysis detailing your home's value as well as a comparison with similar homes in the area
Home Values in the Area
Average Home Value in this Area
Purchase History
| Date | Buyer | Sale Price | Title Company |
|---|---|---|---|
| Hasan Kamran | -- | None Available | |
| Hasan Kamran | $180,000 | -- | |
| Elias Niam J | $155,000 | Professional National Title | |
| American National Bk & Tr Co Of Chicago | $155,000 | First American Title |
Source: Public Records
Mortgage History
| Date | Status | Borrower | Loan Amount |
|---|---|---|---|
| Previous Owner | American National Bk & Tr Co Of Chicago | $77,500 |
Source: Public Records
Tax History Compared to Growth
Tax History
| Year | Tax Paid | Tax Assessment Tax Assessment Total Assessment is a certain percentage of the fair market value that is determined by local assessors to be the total taxable value of land and additions on the property. | Land | Improvement |
|---|---|---|---|---|
| 2024 | $28,032 | $127,000 | $33,262 | $93,738 |
| 2023 | $27,228 | $127,000 | $33,262 | $93,738 |
| 2022 | $27,228 | $127,000 | $33,262 | $93,738 |
| 2021 | $19,498 | $81,705 | $24,946 | $56,759 |
| 2020 | $18,932 | $81,705 | $24,946 | $56,759 |
| 2019 | $18,507 | $90,885 | $24,946 | $65,939 |
| 2018 | $24,160 | $114,383 | $22,867 | $91,516 |
| 2017 | $23,525 | $114,383 | $22,867 | $91,516 |
| 2016 | $22,353 | $114,383 | $22,867 | $91,516 |
| 2015 | $22,859 | $108,446 | $20,789 | $87,657 |
| 2014 | $22,740 | $108,446 | $20,789 | $87,657 |
| 2013 | $21,710 | $108,446 | $20,789 | $87,657 |
Source: Public Records
Map
Nearby Homes
- 190 & Rt 59 W Penny Rd
- 11 Acadia Dr
- 3 Shoreside Dr
- 28 Shenandoah Cir
- 10 Shoreside Dr
- 33 N Liberty Dr
- 43 Wood Oaks Dr
- 8 Brooke Ln
- 22 Westlake Dr
- 2 Tricia Ln
- 189 Old Sutton Rd
- 12 Leanda Ct
- 13 Pacer Trail
- 1 Pacer Trail
- 3 Leanda Ln
- 14 E Penny Rd
- 8 Stone Ridge Dr
- 180A Old Sutton Rd
- 33 Cutters Run
- 309 Dundee Rd