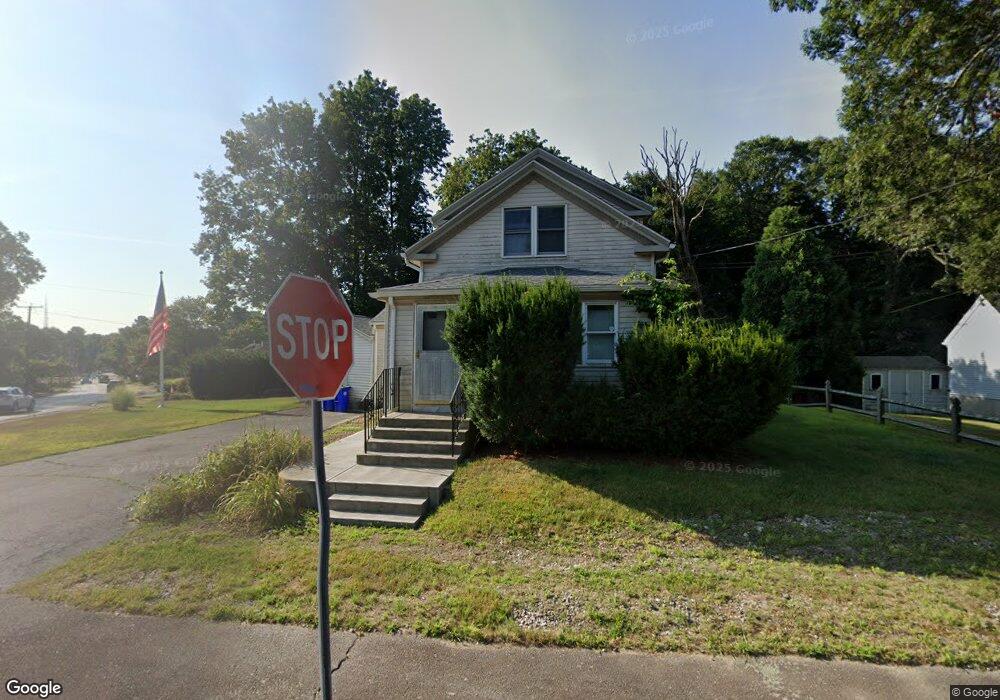
2 Spring St Holbrook, MA 02343
Estimated Value: $500,000 - $538,000
3
Beds
1
Bath
1,359
Sq Ft
$385/Sq Ft
Est. Value
About This Home
This home is located at 2 Spring St, Holbrook, MA 02343 and is currently estimated at $523,081, approximately $384 per square foot. 2 Spring St is a home located in Norfolk County with nearby schools including John F. Kennedy Elementary School, Holbrook Middle High School, and Boston Higashi School.
Ownership History
Date
Name
Owned For
Owner Type
Purchase Details
Closed on
Jan 21, 2025
Sold by
Marks Mary P
Bought by
Mary P Marks Ft and Marks
Current Estimated Value
Purchase Details
Closed on
Oct 30, 1997
Sold by
Norton Timothy O
Bought by
Marks Mary P
Home Financials for this Owner
Home Financials are based on the most recent Mortgage that was taken out on this home.
Original Mortgage
$128,937
Interest Rate
7.31%
Mortgage Type
Purchase Money Mortgage
Purchase Details
Closed on
Jun 10, 1996
Sold by
Savoy Peter E and Savoy Denise D
Bought by
Norton Timothy O
Purchase Details
Closed on
Aug 5, 1991
Sold by
Riendeau Leo M and Riendeau Dolores F
Bought by
Savoy Peter E and Savoy Denise D
Create a Home Valuation Report for This Property
The Home Valuation Report is an in-depth analysis detailing your home's value as well as a comparison with similar homes in the area
Home Values in the Area
Average Home Value in this Area
Purchase History
| Date | Buyer | Sale Price | Title Company |
|---|---|---|---|
| Mary P Marks Ft | -- | None Available | |
| Mary P Marks Ft | -- | None Available | |
| Marks Mary P | $129,900 | -- | |
| Marks Mary P | $129,900 | -- | |
| Norton Timothy O | $45,000 | -- | |
| Norton Timothy O | $45,000 | -- | |
| Savoy Peter E | $75,000 | -- | |
| Savoy Peter E | $75,000 | -- |
Source: Public Records
Mortgage History
| Date | Status | Borrower | Loan Amount |
|---|---|---|---|
| Previous Owner | Savoy Peter E | $113,811 | |
| Previous Owner | Savoy Peter E | $130,620 | |
| Previous Owner | Savoy Peter E | $128,937 |
Source: Public Records
Tax History
| Year | Tax Paid | Tax Assessment Tax Assessment Total Assessment is a certain percentage of the fair market value that is determined by local assessors to be the total taxable value of land and additions on the property. | Land | Improvement |
|---|---|---|---|---|
| 2025 | $60 | $451,500 | $194,600 | $256,900 |
| 2024 | $5,404 | $402,100 | $166,400 | $235,700 |
| 2023 | $5,900 | $383,600 | $160,800 | $222,800 |
| 2022 | $5,552 | $336,700 | $139,900 | $196,800 |
| 2021 | $5,443 | $316,100 | $130,800 | $185,300 |
| 2020 | $5,601 | $304,900 | $126,900 | $178,000 |
| 2019 | $5,443 | $279,700 | $106,500 | $173,200 |
| 2018 | $5,597 | $270,800 | $103,400 | $167,400 |
| 2017 | $5,478 | $262,100 | $103,400 | $158,700 |
| 2016 | $4,543 | $231,300 | $85,500 | $145,800 |
| 2015 | $4,241 | $222,300 | $82,300 | $140,000 |
| 2014 | $4,173 | $222,300 | $82,300 | $140,000 |
Source: Public Records
Map
Nearby Homes
- 14 Leonard Ln
- 68 Spring St
- 12 Hamilton Way
- 660 S Franklin St
- 27 Valley Rd
- 1004 S Franklin St
- 719 S Franklin St Unit C Block 1
- 193 E Spring St
- 191 E Spring St
- 52 Quincy St
- 192 E Spring St
- 68 Robbins St
- 45 Braintree Ave
- 24 Reeds Ln
- 2 Glendower St
- 375 S Franklin St Unit 1
- 12 W High St
- 46 Gill St
- 95 Rindone St
- 226 W Main St
Your Personal Tour Guide
Ask me questions while you tour the home.