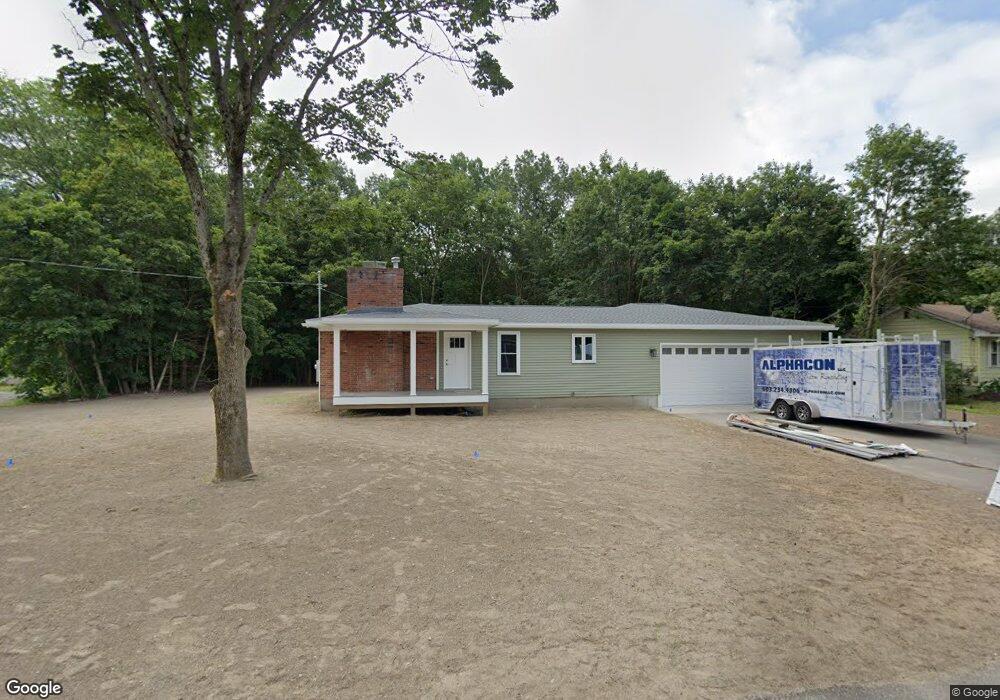
2 Spruce St Hudson, NH 03051
Estimated Value: $448,761 - $508,000
3
Beds
1
Bath
1,268
Sq Ft
$384/Sq Ft
Est. Value
About This Home
This home is located at 2 Spruce St, Hudson, NH 03051 and is currently estimated at $487,440, approximately $384 per square foot. 2 Spruce St is a home located in Hillsborough County with nearby schools including Nottingham West Elementary School, Hudson Memorial School, and Alvirne High School.
Ownership History
Date
Name
Owned For
Owner Type
Purchase Details
Closed on
Sep 15, 2017
Sold by
Gardner James A and Gardner Rose M
Bought by
James & Rose Gardner Ft
Current Estimated Value
Purchase Details
Closed on
Aug 18, 1999
Sold by
Robert T Dumont Ret and Rvkbl Lucille M Dumon
Bought by
Sheppard Matthew J and Sheppard Suzanna L
Home Financials for this Owner
Home Financials are based on the most recent Mortgage that was taken out on this home.
Original Mortgage
$156,921
Interest Rate
7.6%
Purchase Details
Closed on
Aug 26, 1981
Bought by
Gardner James A and Gardner Rose M
Create a Home Valuation Report for This Property
The Home Valuation Report is an in-depth analysis detailing your home's value as well as a comparison with similar homes in the area
Home Values in the Area
Average Home Value in this Area
Purchase History
| Date | Buyer | Sale Price | Title Company |
|---|---|---|---|
| James & Rose Gardner Ft | -- | -- | |
| Sheppard Matthew J | $157,000 | -- | |
| Gardner James A | -- | -- |
Source: Public Records
Mortgage History
| Date | Status | Borrower | Loan Amount |
|---|---|---|---|
| Previous Owner | Gardner James A | $156,921 |
Source: Public Records
Tax History
| Year | Tax Paid | Tax Assessment Tax Assessment Total Assessment is a certain percentage of the fair market value that is determined by local assessors to be the total taxable value of land and additions on the property. | Land | Improvement |
|---|---|---|---|---|
| 2025 | $5,778 | $337,700 | $133,600 | $204,100 |
| 2024 | $5,588 | $339,700 | $133,600 | $206,100 |
| 2023 | $5,326 | $339,700 | $133,600 | $206,100 |
| 2022 | $4,990 | $339,700 | $133,600 | $206,100 |
| 2021 | $5,066 | $233,800 | $90,000 | $143,800 |
| 2020 | $4,996 | $233,800 | $90,000 | $143,800 |
| 2019 | $4,741 | $233,800 | $90,000 | $143,800 |
| 2018 | $4,699 | $233,800 | $90,000 | $143,800 |
| 2017 | $4,611 | $233,800 | $90,000 | $143,800 |
| 2016 | $4,339 | $197,500 | $85,900 | $111,600 |
| 2015 | $4,197 | $197,500 | $85,900 | $111,600 |
| 2014 | $4,114 | $197,500 | $85,900 | $111,600 |
| 2013 | $4,061 | $197,500 | $85,900 | $111,600 |
Source: Public Records
Map
Nearby Homes
Your Personal Tour Guide
Ask me questions while you tour the home.