2 Staci Dr Bridgewater, MA 02324
Estimated Value: $824,000 - $882,000
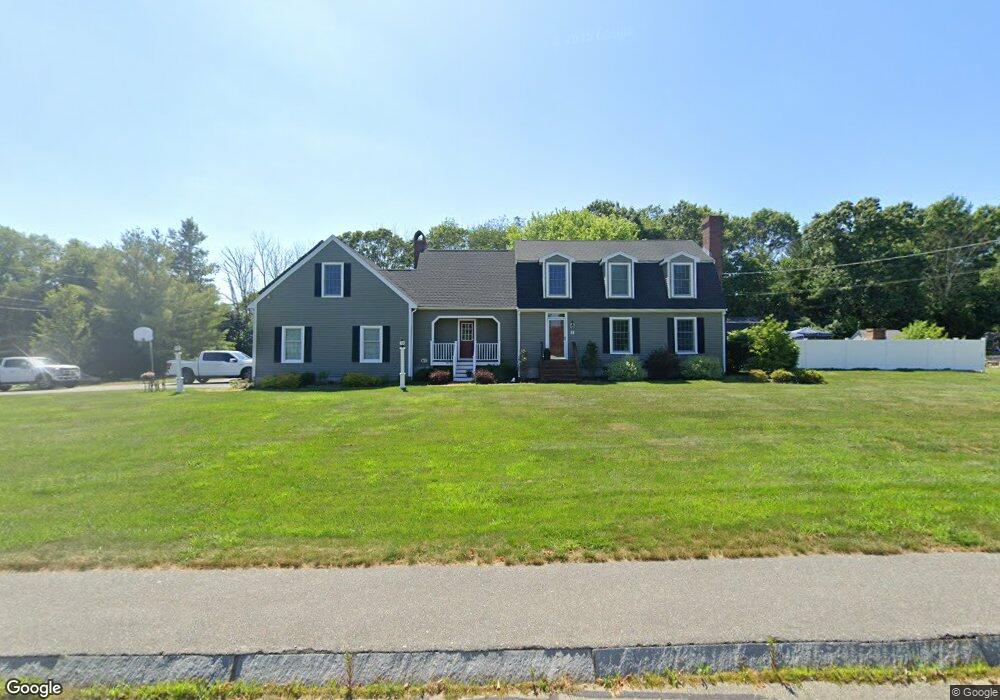
About This Home
This home is located at 2 Staci Dr, Bridgewater, MA 02324 and is currently estimated at $843,200, approximately $327 per square foot. 2 Staci Dr is a home located in Plymouth County with nearby schools including Mitchell Elementary School, Williams Intermediate School, and Bridgewater Middle School.
Ownership History
We collect this data history from publicly available records. To have your information removed, we recommend requesting removal directly through your county’s website.
Purchase Details
Home Financials for this Owner
Home Financials are based on the most recent Mortgage that was taken out on this home.Home Values in the Area
Average Home Value in this Area
Purchase History
We collect this data history from publicly available records. To have your information removed, we recommend requesting removal directly through your county’s website.
| Date | Buyer | Sale Price | Title Company |
|---|---|---|---|
| $78,500 | -- |
Mortgage History
We collect this data history from publicly available records. To have your information removed, we recommend requesting removal directly through your county’s website.
| Date | Status | Borrower | Loan Amount |
|---|---|---|---|
| Open | $295,000 | ||
| Closed | $45,000 | ||
| Closed | $147,300 |
Tax History
We collect this data history from publicly available records. To have your information removed, we recommend requesting removal directly through your county’s website.
| Year | Tax Paid | Tax Assessment Tax Assessment Total Assessment is a certain percentage of the fair market value that is determined by local assessors to be the total taxable value of land and additions on the property. | Land | Improvement |
|---|---|---|---|---|
| 2025 | $8,972 | $758,400 | $236,500 | $521,900 |
| 2024 | $8,718 | $718,100 | $225,300 | $492,800 |
| 2023 | $8,628 | $672,000 | $210,500 | $461,500 |
| 2022 | $8,529 | $595,600 | $184,700 | $410,900 |
| 2021 | $7,965 | $550,100 | $164,900 | $385,200 |
| 2020 | $7,866 | $534,000 | $158,500 | $375,500 |
| 2019 | $7,537 | $508,200 | $158,500 | $349,700 |
| 2018 | $6,097 | $488,100 | $154,000 | $334,100 |
| 2017 | $7,132 | $456,900 | $154,000 | $302,900 |
| 2016 | $6,808 | $438,100 | $151,000 | $287,100 |
| 2015 | $6,844 | $421,400 | $146,500 | $274,900 |
| 2014 | $6,705 | $412,600 | $142,200 | $270,400 |
Map
- 65 Grange Park
- 92 Norlen Park
- 35 Stockbridge Rd
- 40 Legge St
- 3 Jasmine Way
- 5 Jasmine Way
- 82 Concetta Dr
- 120 Ashtead Rd
- 71 Forest St
- 101 Atkinson Dr
- 1 Jennifer Cir
- 85 Fox Hill Dr
- 27 Brian Rd
- 365 Elm St
- 0 Locust St
- 162 Bayberry Rd
- 45 Flagstone Place Unit 45
- 220 Bedford St Unit E-6
- 220 Bedford St Unit F4
- 220 Bedford St Unit B11
Ask me questions while you tour the home.