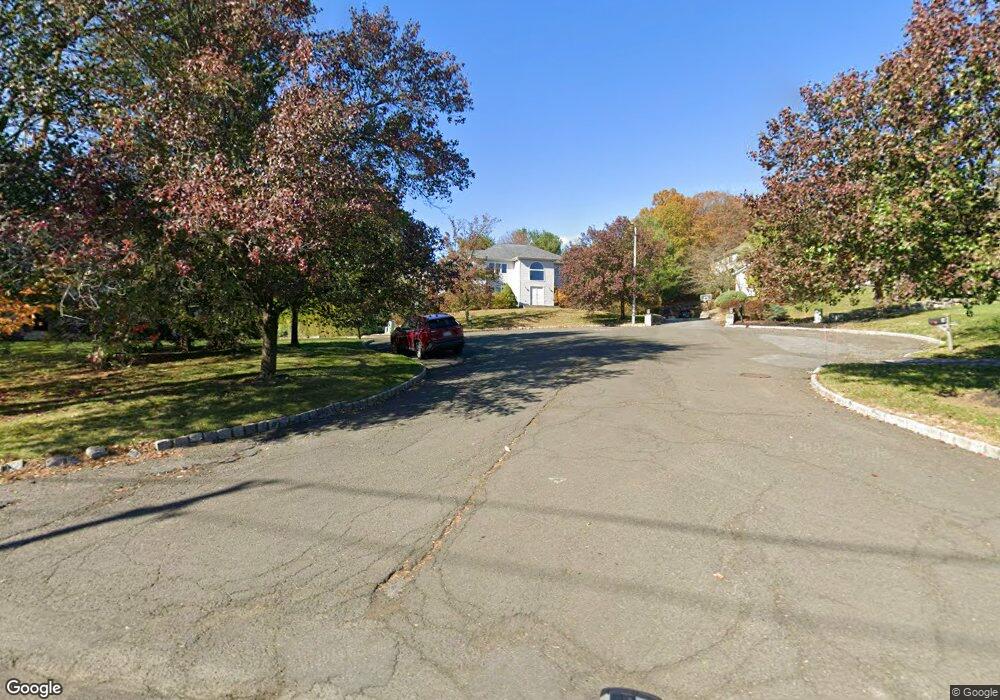
2 Stonlea Ct Nanuet, NY 10954
Estimated Value: $1,047,274 - $1,287,000
5
Beds
3
Baths
3,333
Sq Ft
$352/Sq Ft
Est. Value
About This Home
This home is located at 2 Stonlea Ct, Nanuet, NY 10954 and is currently estimated at $1,171,819, approximately $351 per square foot. 2 Stonlea Ct is a home located in Rockland County with nearby schools including Highview Elementary School, George W Miller Elementary School, and A Macarthur Barr Middle School.
Ownership History
Date
Name
Owned For
Owner Type
Purchase Details
Closed on
May 16, 2002
Sold by
Schairer Robert and Schairer Keong
Bought by
Schairer Robert
Current Estimated Value
Purchase Details
Closed on
Dec 26, 1996
Sold by
Bradley Development Corp
Bought by
Baldwin Development Corp
Home Financials for this Owner
Home Financials are based on the most recent Mortgage that was taken out on this home.
Original Mortgage
$150,000
Interest Rate
7.07%
Mortgage Type
Construction
Purchase Details
Closed on
Dec 20, 1996
Sold by
Baldwin Development Corp
Bought by
Schairer Robert and Schairer Keong
Home Financials for this Owner
Home Financials are based on the most recent Mortgage that was taken out on this home.
Original Mortgage
$150,000
Interest Rate
7.07%
Mortgage Type
Construction
Create a Home Valuation Report for This Property
The Home Valuation Report is an in-depth analysis detailing your home's value as well as a comparison with similar homes in the area
Home Values in the Area
Average Home Value in this Area
Purchase History
| Date | Buyer | Sale Price | Title Company |
|---|---|---|---|
| Schairer Robert | -- | -- | |
| Baldwin Development Corp | -- | Chicago Title | |
| Schairer Robert | $300,700 | Nations Title |
Source: Public Records
Mortgage History
| Date | Status | Borrower | Loan Amount |
|---|---|---|---|
| Closed | Schairer Robert | $150,000 |
Source: Public Records
Tax History
| Year | Tax Paid | Tax Assessment Tax Assessment Total Assessment is a certain percentage of the fair market value that is determined by local assessors to be the total taxable value of land and additions on the property. | Land | Improvement |
|---|---|---|---|---|
| 2024 | $24,045 | $182,200 | $32,800 | $149,400 |
| 2023 | $24,045 | $182,200 | $32,800 | $149,400 |
| 2022 | $20,161 | $182,200 | $32,800 | $149,400 |
| 2021 | $20,161 | $182,200 | $32,800 | $149,400 |
| 2020 | $19,837 | $182,200 | $32,800 | $149,400 |
| 2019 | $19,309 | $182,200 | $32,800 | $149,400 |
| 2018 | $19,309 | $182,200 | $32,800 | $149,400 |
| 2017 | $18,929 | $182,200 | $32,800 | $149,400 |
| 2016 | $18,665 | $182,200 | $32,800 | $149,400 |
| 2015 | -- | $182,200 | $32,800 | $149,400 |
| 2014 | -- | $182,200 | $32,800 | $149,400 |
Source: Public Records
Map
Nearby Homes
- 13 Mesa Place
- 18 Mesa Place
- 3 Scotland Hill Park
- 6 Roxbury Ct
- 11 Brookview Blvd
- 167 Grandview Ave
- 69 New Holland Village Unit 69
- 75 Freedman Ave
- 31 S Lexow Ave
- 31 N Lexow Ave
- 31-37 Scotland Hill Rd
- 600 Tudor Hill Unit 600
- 30 N Lexow Ave
- 5 Carrie Ln
- 3 Lomond Ave
- 2 Henry Ct
- 66 Gerow Ave
- 711 Chestnut Ridge Rd
- 67 Gerow Ave
- 12 Omni Parc Dr
Your Personal Tour Guide
Ask me questions while you tour the home.