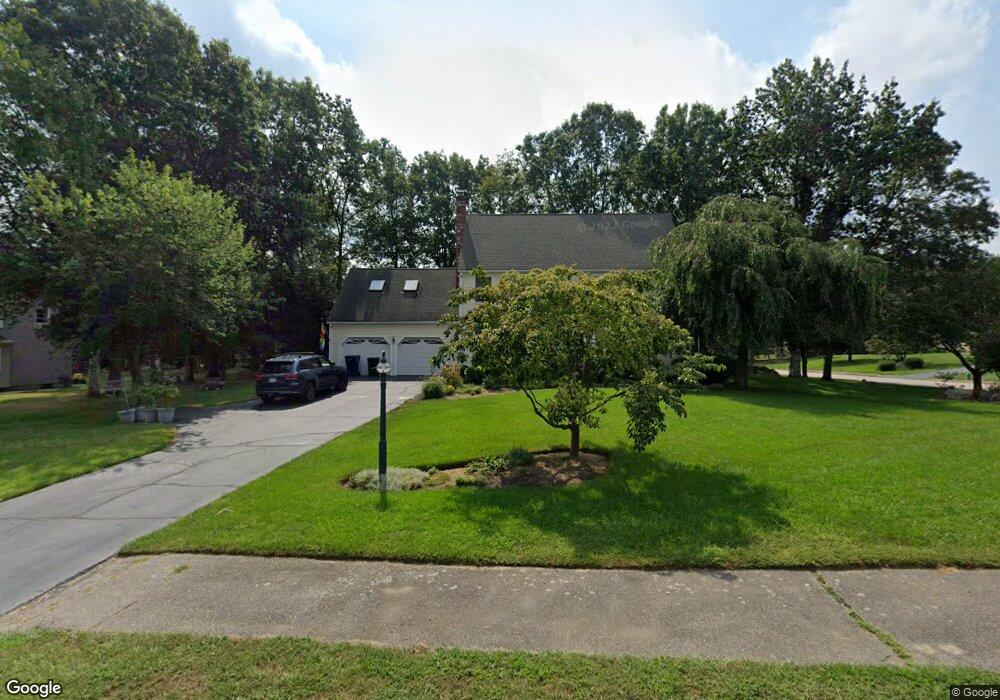
2 Stony Ridge Rd Medway, MA 02053
Estimated Value: $787,134 - $953,000
4
Beds
3
Baths
2,661
Sq Ft
$324/Sq Ft
Est. Value
About This Home
This home is located at 2 Stony Ridge Rd, Medway, MA 02053 and is currently estimated at $862,284, approximately $324 per square foot. 2 Stony Ridge Rd is a home located in Norfolk County with nearby schools including John D. McGovern Elementary School, Burke-Memorial Elementary, and Medway Middle School.
Ownership History
Date
Name
Owned For
Owner Type
Purchase Details
Closed on
Aug 20, 2020
Sold by
Pfeiffer Richard M and Pfeiffer Margaret M
Bought by
Pfeiffer Richard M and Pfeiffer Patricia
Current Estimated Value
Home Financials for this Owner
Home Financials are based on the most recent Mortgage that was taken out on this home.
Original Mortgage
$420,000
Outstanding Balance
$370,889
Interest Rate
3%
Mortgage Type
New Conventional
Estimated Equity
$491,395
Create a Home Valuation Report for This Property
The Home Valuation Report is an in-depth analysis detailing your home's value as well as a comparison with similar homes in the area
Home Values in the Area
Average Home Value in this Area
Purchase History
| Date | Buyer | Sale Price | Title Company |
|---|---|---|---|
| Pfeiffer Richard M | $570,000 | None Available | |
| Pfeiffer Richard M | $570,000 | None Available |
Source: Public Records
Mortgage History
| Date | Status | Borrower | Loan Amount |
|---|---|---|---|
| Open | Pfeiffer Richard M | $420,000 | |
| Closed | Pfeiffer Richard M | $420,000 |
Source: Public Records
Tax History Compared to Growth
Tax History
| Year | Tax Paid | Tax Assessment Tax Assessment Total Assessment is a certain percentage of the fair market value that is determined by local assessors to be the total taxable value of land and additions on the property. | Land | Improvement |
|---|---|---|---|---|
| 2025 | $9,870 | $692,600 | $325,500 | $367,100 |
| 2024 | $9,973 | $692,600 | $325,500 | $367,100 |
| 2023 | $9,875 | $619,500 | $296,300 | $323,200 |
| 2022 | $9,019 | $532,700 | $219,100 | $313,600 |
| 2021 | $9,051 | $518,400 | $204,500 | $313,900 |
| 2020 | $9,007 | $514,700 | $204,500 | $310,200 |
| 2019 | $8,397 | $494,800 | $196,100 | $298,700 |
| 2018 | $8,459 | $479,000 | $187,800 | $291,200 |
| 2017 | $8,376 | $467,400 | $183,600 | $283,800 |
| 2016 | $8,019 | $442,800 | $169,000 | $273,800 |
| 2015 | $7,953 | $436,000 | $166,900 | $269,100 |
| 2014 | $7,724 | $410,000 | $166,900 | $243,100 |
Source: Public Records
Map
Nearby Homes
- 22 Granite St
- 9 Tulip Way
- 6 Rainbow Dr
- 4 Deerfield Rd
- 78 Fisher St
- 39 West St
- 85 Fisher St
- 0 Old Log Lane (Farm St) Unit 73416329
- 462 Hartford Ave
- 455 Hartford Ave
- 387 Hartford Ave
- 6 Freedom Trail
- 48 Black Bear Cir Unit 48
- 43 Black Bear Cir Unit 43
- 11 Black Bear Unit 11
- 9 Black Bear Cir Unit 9
- 7 Black Bear Unit 7
- 3 Black Bear Cir Unit 3
- 10 Black Bear Unit 10
- 33 Brown Bear Ln Unit 33