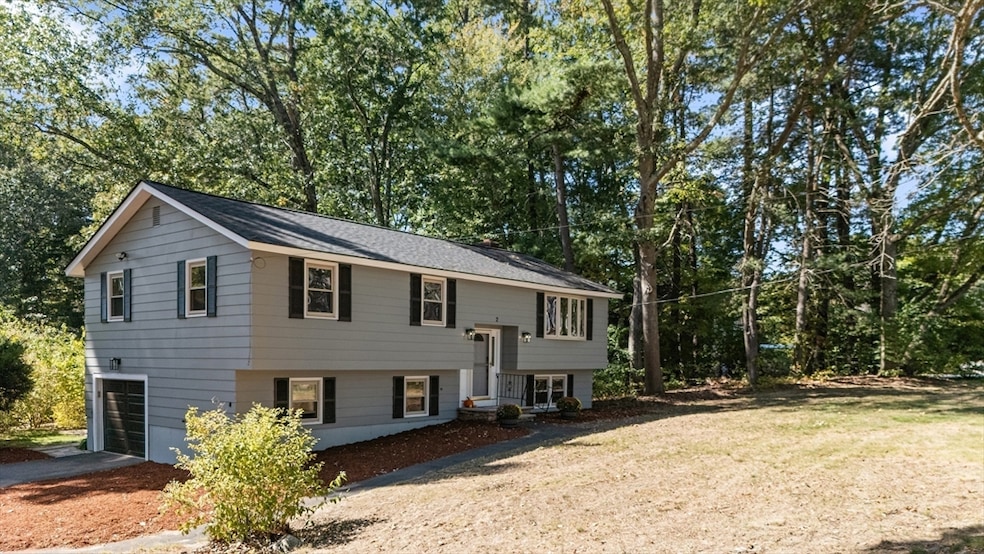
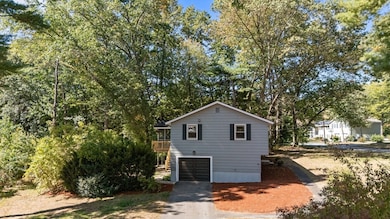
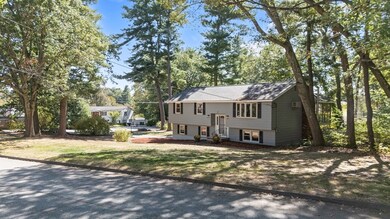
2 Sugar Hill Cir Methuen, MA 01844
The West End NeighborhoodEstimated payment $3,681/month
Highlights
- Wooded Lot
- Corner Lot
- 1 Car Attached Garage
- 1 Fireplace
- No HOA
- Cooling System Mounted In Outer Wall Opening
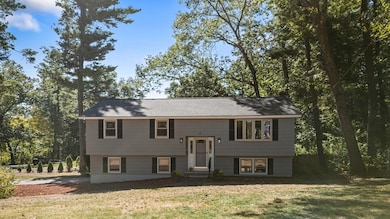
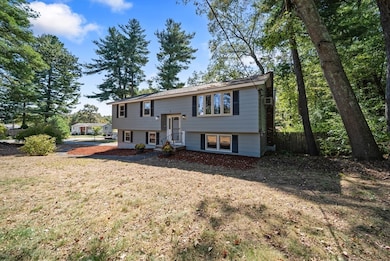
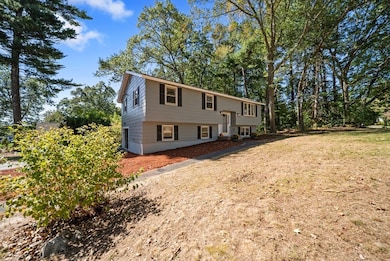
About This Home
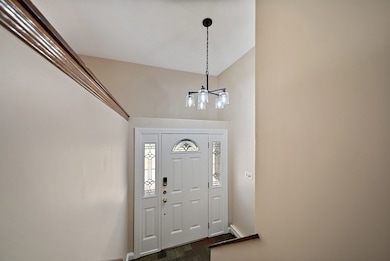
Welcome to this beautifully maintained split-level home nestled in one of Methuen’s most desirable West neighborhoods. Featuring 3 bedrooms, this property offers a warm and inviting layout with hardwood floors, fresh paint, and abundant natural sunlight throughout. The kitchen has been thoughtfully updated with new quartz countertops and stainless steel appliances, opening into a comfortable living and dining area perfect for everyday living and entertaining. Step outside to enjoy the screened porch and deck overlooking the private backyard—ideal for relaxing or hosting gatherings. The finished basement provides additional living space and includes a walk-out to the yard. Some additional recent updates include a new roof, new light fixtures, and freshly painted exterior giving the home a fresh, move-in ready feel. Located in a charming and quiet neighborhood, this home combines comfort, updates, and location all in one. Don't miss the opportunity to make this Methuen gem your own!
Listing Agent
Meghan Tate
Jill & Co. Realty Group Listed on: 09/25/2025
Home Details
Home Type
- Single Family
Est. Annual Taxes
- $5,279
Year Built
- Built in 1973
Lot Details
- 0.47 Acre Lot
- Corner Lot
- Wooded Lot
- Property is zoned RB
Parking
- 1 Car Attached Garage
- Tuck Under Parking
- Driveway
- Open Parking
Home Design
- Split Level Home
- Concrete Perimeter Foundation
Interior Spaces
- 1 Fireplace
Bedrooms and Bathrooms
- 3 Bedrooms
Partially Finished Basement
- Walk-Out Basement
- Interior Basement Entry
- Garage Access
Utilities
- Cooling System Mounted In Outer Wall Opening
- Electric Baseboard Heater
Community Details
- No Home Owners Association
Listing and Financial Details
- Assessor Parcel Number 2037262
Map
Home Values in the Area
Average Home Value in this Area
Tax History
| Year | Tax Paid | Tax Assessment Tax Assessment Total Assessment is a certain percentage of the fair market value that is determined by local assessors to be the total taxable value of land and additions on the property. | Land | Improvement |
|---|---|---|---|---|
| 2025 | $5,279 | $499,000 | $247,700 | $251,300 |
| 2024 | $5,298 | $487,800 | $225,200 | $262,600 |
| 2023 | $5,019 | $429,000 | $201,100 | $227,900 |
| 2022 | $4,723 | $361,900 | $160,800 | $201,100 |
| 2021 | $4,491 | $340,500 | $152,800 | $187,700 |
| 2020 | $4,467 | $332,400 | $152,800 | $179,600 |
| 2019 | $4,413 | $311,000 | $144,800 | $166,200 |
| 2018 | $4,284 | $300,200 | $144,800 | $155,400 |
| 2017 | $4,152 | $283,400 | $144,800 | $138,600 |
| 2016 | $4,114 | $277,800 | $144,800 | $133,000 |
| 2015 | $4,015 | $275,000 | $144,800 | $130,200 |
Property History
| Date | Event | Price | List to Sale | Price per Sq Ft |
|---|---|---|---|---|
| 10/29/2025 10/29/25 | Pending | -- | -- | -- |
| 10/15/2025 10/15/25 | Price Changed | $615,000 | -3.1% | $362 / Sq Ft |
| 09/25/2025 09/25/25 | For Sale | $635,000 | -- | $374 / Sq Ft |
Purchase History
| Date | Type | Sale Price | Title Company |
|---|---|---|---|
| Quit Claim Deed | -- | None Available | |
| Quit Claim Deed | -- | None Available | |
| Deed | -- | -- |
Mortgage History
| Date | Status | Loan Amount | Loan Type |
|---|---|---|---|
| Previous Owner | $25,000 | No Value Available | |
| Previous Owner | $20,000 | No Value Available | |
| Previous Owner | $20,000 | No Value Available |
Source: MLS Property Information Network (MLS PIN)
MLS Number: 73435591
APN: METH-000316-000130-000045F
Disclaimer: Certain information contained herein is derived from information provided by parties other than Homes.com. All information provided is deemed reliable, but is not guaranteed to be accurate and should be independently verified.
![]() The property listing data and information, or the Images, set forth herein were provided to MLS Property Information Network, Inc. from third party sources, including sellers, lessors and public records, and were compiled by MLS Property Information Network, Inc. The property listing data and information, and the Images, are for the personal, non-commercial use of consumers having a good faith interest in purchasing or leasing listed properties of the type displayed to them and may not be used for any purpose other than to identify prospective properties which such consumers may have a good faith interest in purchasing or leasing. MLS Property Information Network, Inc. and its subscribers disclaim any and all representations and warranties as to the accuracy of the property listing data and information, or as to the accuracy of any of the Images, set forth herein.
The property listing data and information, or the Images, set forth herein were provided to MLS Property Information Network, Inc. from third party sources, including sellers, lessors and public records, and were compiled by MLS Property Information Network, Inc. The property listing data and information, and the Images, are for the personal, non-commercial use of consumers having a good faith interest in purchasing or leasing listed properties of the type displayed to them and may not be used for any purpose other than to identify prospective properties which such consumers may have a good faith interest in purchasing or leasing. MLS Property Information Network, Inc. and its subscribers disclaim any and all representations and warranties as to the accuracy of the property listing data and information, or as to the accuracy of any of the Images, set forth herein.
- 1 Tilbury Rd
- 38 Butternut Ln
- 86 Butternut Ln
- 90 Butternut Ln
- 14 Youngfarm Rd
- 13 Riverview Ave
- 492 Lowell St
- 24 N Lowell St
- 73 Myrtle St
- 100 Salem Rd
- 5 Bailey Rd
- 50 & 51 Jane St
- 11 Vineyard Ln Unit 11
- 362 Lowell St
- 128 West St
- 35 Memorial Dr
- 1 Bridle Path Ln
- 44 Hopkins Cir Unit 44
- 96 Harris St
- 220 Pelham St
