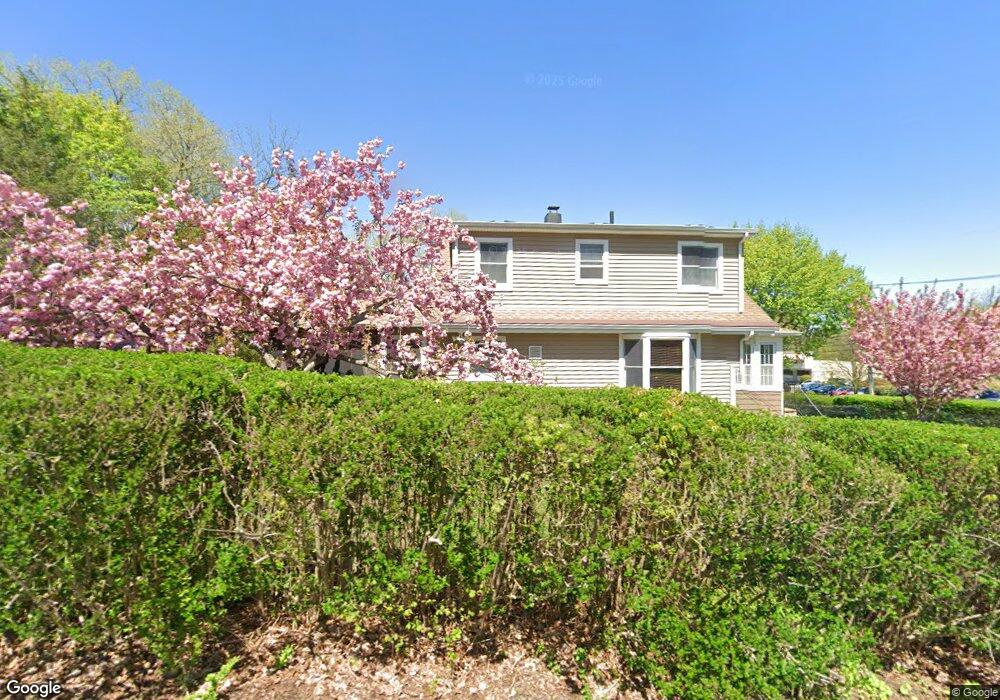
2 Summit Ave Harriman, NY 10926
Estimated Value: $397,000 - $538,000
4
Beds
3
Baths
1,510
Sq Ft
$325/Sq Ft
Est. Value
About This Home
This home is located at 2 Summit Ave, Harriman, NY 10926 and is currently estimated at $490,294, approximately $324 per square foot. 2 Summit Ave is a home located in Orange County with nearby schools including Monroe-Woodbury Middle School, Monroe-Woodbury High School, and St. Paul Christian Education Center.
Ownership History
Date
Name
Owned For
Owner Type
Purchase Details
Closed on
Jul 14, 2023
Sold by
Frankild James C and Frankild Tracy A
Bought by
Mulkey Dustin
Current Estimated Value
Home Financials for this Owner
Home Financials are based on the most recent Mortgage that was taken out on this home.
Original Mortgage
$427,500
Interest Rate
7.23%
Mortgage Type
New Conventional
Purchase Details
Closed on
Oct 31, 2003
Sold by
Reilly Dameon E
Bought by
Frankild James
Purchase Details
Closed on
Feb 3, 1999
Sold by
Streichert Jeffrey P and Streichert Loretta A
Bought by
Reilly Dameon E and Reilly Monique L
Home Financials for this Owner
Home Financials are based on the most recent Mortgage that was taken out on this home.
Original Mortgage
$139,900
Interest Rate
6.75%
Mortgage Type
FHA
Create a Home Valuation Report for This Property
The Home Valuation Report is an in-depth analysis detailing your home's value as well as a comparison with similar homes in the area
Home Values in the Area
Average Home Value in this Area
Purchase History
| Date | Buyer | Sale Price | Title Company |
|---|---|---|---|
| Mulkey Dustin | $478,500 | None Available | |
| Mulkey Dustin | $478,500 | None Available | |
| Frankild James | $280,000 | Lisa Felicissimo | |
| Frankild James | $280,000 | Lisa Felicissimo | |
| Reilly Dameon E | $140,000 | Stewart Title Insurance Co | |
| Reilly Dameon E | $140,000 | Stewart Title Insurance Co |
Source: Public Records
Mortgage History
| Date | Status | Borrower | Loan Amount |
|---|---|---|---|
| Previous Owner | Mulkey Dustin | $427,500 | |
| Previous Owner | Reilly Dameon E | $139,900 |
Source: Public Records
Tax History Compared to Growth
Tax History
| Year | Tax Paid | Tax Assessment Tax Assessment Total Assessment is a certain percentage of the fair market value that is determined by local assessors to be the total taxable value of land and additions on the property. | Land | Improvement |
|---|---|---|---|---|
| 2024 | $9,012 | $35,200 | $8,400 | $26,800 |
| 2023 | $9,012 | $35,200 | $8,400 | $26,800 |
| 2022 | $8,578 | $35,200 | $8,400 | $26,800 |
| 2021 | $8,502 | $35,200 | $8,400 | $26,800 |
| 2020 | $7,470 | $35,200 | $8,400 | $26,800 |
| 2019 | $7,262 | $35,200 | $8,400 | $26,800 |
| 2018 | $7,262 | $35,200 | $8,400 | $26,800 |
| 2017 | $7,134 | $35,200 | $8,400 | $26,800 |
| 2016 | $7,151 | $35,200 | $8,400 | $26,800 |
| 2015 | -- | $35,200 | $8,400 | $26,800 |
| 2014 | -- | $35,200 | $8,400 | $26,800 |
Source: Public Records
Map
Nearby Homes
- 1 Heritage Dr Unit 1 H
- 9 Heritage Dr Unit B
- 8 Heritage Dr Unit A
- 5 Heritage Dr Unit D
- 5 Heritage Dr Unit C
- 12 Edgewood Dr
- 34 Clark Ln
- 2 Fawn Ridge Ct
- 17 Arlington Dr
- 26 Lexington Hill Unit 1
- 9 Woodland Rd
- 9 Melody Ln
- 314 Harriman Heights Rd
- 46 Woodland Rd
- 229 Orchard Dr
- 12 Case Ct
- 3 Webster Ct
- 5 Case Ct
- 86 Talbot Rd
- 254 Orchard Dr
- 55 New York 17m
- 59 State Route 17m
- 3 Summit Ave
- 48 State Route 17m
- 63 State Route 17m
- 5 Summit Ave
- 39 Eden Rd
- 1 Heritage Dr Unit 1F
- 1 Heritage Dr
- 1 Heritage Dr
- 1 Heritage Dr
- 1 Heritage Dr
- 1 Heritage Dr
- 1 Heritage Dr
- 1 Heritage Dr Unit E
- 1 Heritage Dr
- 1 Heritage Dr Unit F
- 1 Heritage Dr Unit B
- 1 Heritage Dr Unit G
- 33 Eden Rd