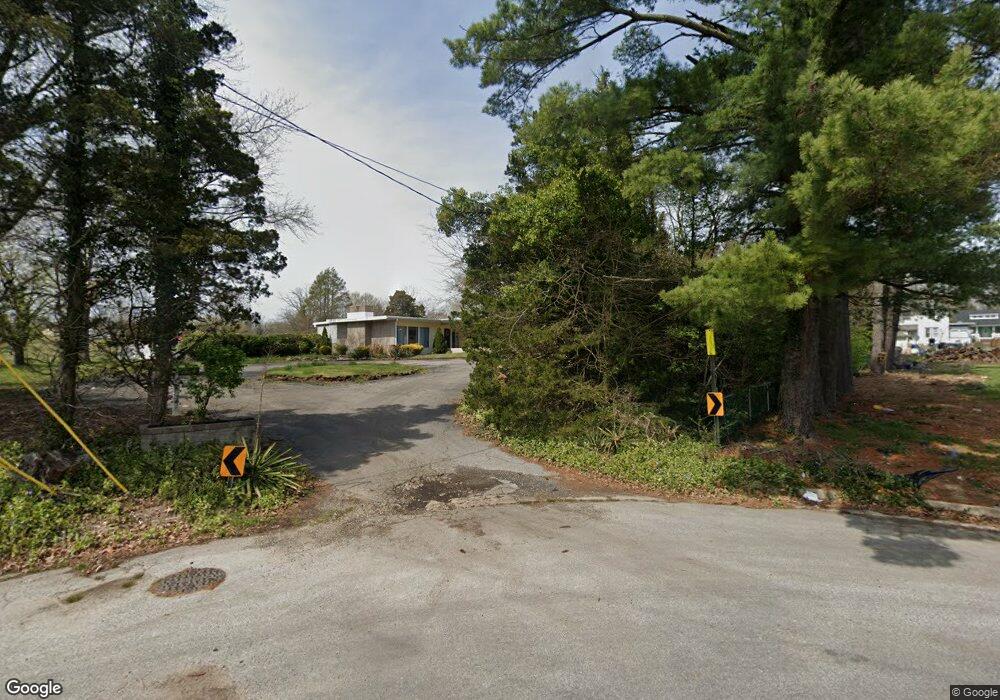
2 Suncrest Ave Bridgeton, NJ 08302
Estimated Value: $234,864 - $345,000
Studio
--
Bath
2,180
Sq Ft
$133/Sq Ft
Est. Value
About This Home
This home is located at 2 Suncrest Ave, Bridgeton, NJ 08302 and is currently estimated at $290,966, approximately $133 per square foot. 2 Suncrest Ave is a home located in Cumberland County with nearby schools including Bridgeton High School, Bridgeton Christian School, and Immaculate Conception School.
Ownership History
Date
Name
Owned For
Owner Type
Purchase Details
Closed on
Oct 3, 1997
Sold by
Ravens Joan
Bought by
Riebel John and Riebel Donna
Current Estimated Value
Home Financials for this Owner
Home Financials are based on the most recent Mortgage that was taken out on this home.
Original Mortgage
$79,000
Outstanding Balance
$12,703
Interest Rate
7.46%
Estimated Equity
$278,263
Create a Home Valuation Report for This Property
The Home Valuation Report is an in-depth analysis detailing your home's value as well as a comparison with similar homes in the area
Home Values in the Area
Average Home Value in this Area
Purchase History
| Date | Buyer | Sale Price | Title Company |
|---|---|---|---|
| Riebel John | $99,000 | -- |
Source: Public Records
Mortgage History
| Date | Status | Borrower | Loan Amount |
|---|---|---|---|
| Open | Riebel John | $79,000 |
Source: Public Records
Tax History
| Year | Tax Paid | Tax Assessment Tax Assessment Total Assessment is a certain percentage of the fair market value that is determined by local assessors to be the total taxable value of land and additions on the property. | Land | Improvement |
|---|---|---|---|---|
| 2025 | $7,837 | $148,200 | $10,900 | $137,300 |
| 2024 | $7,521 | $148,200 | $10,900 | $137,300 |
| 2023 | $7,521 | $148,200 | $10,900 | $137,300 |
| 2022 | $7,452 | $148,200 | $10,900 | $137,300 |
| 2021 | $7,435 | $148,200 | $10,900 | $137,300 |
| 2020 | $7,386 | $148,200 | $10,900 | $137,300 |
| 2019 | $6,683 | $137,200 | $10,900 | $126,300 |
| 2018 | $6,389 | $137,200 | $10,900 | $126,300 |
| 2017 | $6,204 | $137,200 | $10,900 | $126,300 |
| 2016 | $6,019 | $137,200 | $10,900 | $126,300 |
| 2015 | $5,913 | $137,200 | $10,900 | $126,300 |
| 2014 | $7,523 | $132,800 | $18,100 | $114,700 |
Source: Public Records
Map
Nearby Homes
- 16 New St
- 183 Fayette St
- 252 Fayette St
- 395 W Broad St
- 151 W Commerce St
- 225 W Commerce St
- 354
- 283 W Commerce Extension
- 66 1/2 N West Ave
- 23 Lake St
- 0 E Commerce St Unit NJCB2028764
- 88 Westwood Ave
- 18 Cornell Ave
- 8 Jay Ave
- 34 Townsend Ave
- 4 Townsend Ave
- 39 Cedar St
- 262 Roadstown Rd
- 19 Oak Dr
- 102 Walnut St
Your Personal Tour Guide
Ask me questions while you tour the home.