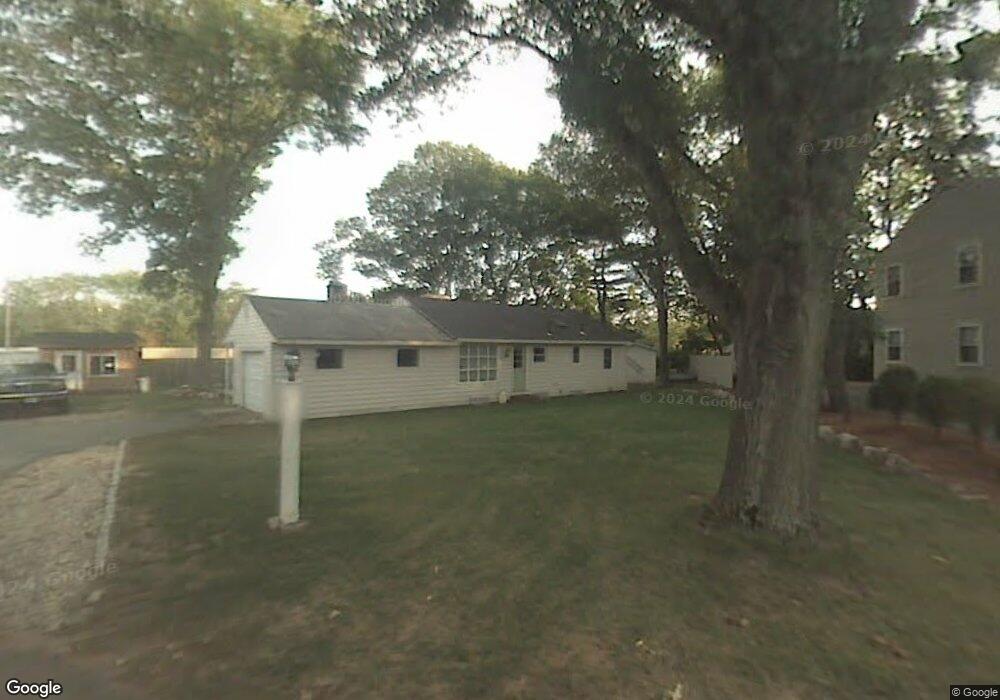
2 Suntaug St Lynnfield, MA 01940
Estimated Value: $544,000 - $661,000
2
Beds
1
Bath
1,140
Sq Ft
$534/Sq Ft
Est. Value
About This Home
This home is located at 2 Suntaug St, Lynnfield, MA 01940 and is currently estimated at $608,600, approximately $533 per square foot. 2 Suntaug St is a home located in Essex County with nearby schools including Pickering Middle School, Lynnfield High School, and Our Lady Of Assumption School.
Ownership History
Date
Name
Owned For
Owner Type
Purchase Details
Closed on
Aug 14, 2003
Sold by
Copeland Rt and Mcnamara James D
Bought by
Dynan Dean R
Current Estimated Value
Home Financials for this Owner
Home Financials are based on the most recent Mortgage that was taken out on this home.
Original Mortgage
$225,000
Outstanding Balance
$105,286
Interest Rate
6.25%
Estimated Equity
$503,314
Purchase Details
Closed on
May 16, 1996
Sold by
Oshea Maxine Est and Mcnamara James D
Bought by
Copeland Rt and Mcnamara James D
Create a Home Valuation Report for This Property
The Home Valuation Report is an in-depth analysis detailing your home's value as well as a comparison with similar homes in the area
Home Values in the Area
Average Home Value in this Area
Purchase History
| Date | Buyer | Sale Price | Title Company |
|---|---|---|---|
| Dynan Dean R | $247,500 | -- | |
| Copeland Rt | $132,000 | -- |
Source: Public Records
Mortgage History
| Date | Status | Borrower | Loan Amount |
|---|---|---|---|
| Open | Copeland Rt | $225,000 | |
| Closed | Copeland Rt | $177,000 |
Source: Public Records
Tax History Compared to Growth
Tax History
| Year | Tax Paid | Tax Assessment Tax Assessment Total Assessment is a certain percentage of the fair market value that is determined by local assessors to be the total taxable value of land and additions on the property. | Land | Improvement |
|---|---|---|---|---|
| 2025 | $4,791 | $453,700 | $320,800 | $132,900 |
| 2024 | $4,336 | $412,600 | $291,600 | $121,000 |
| 2023 | $4,560 | $403,500 | $291,600 | $111,900 |
| 2022 | $4,319 | $360,200 | $263,800 | $96,400 |
| 2021 | $4,114 | $310,000 | $218,000 | $92,000 |
| 2020 | $4,045 | $290,600 | $198,600 | $92,000 |
| 2019 | $4,042 | $290,600 | $198,600 | $92,000 |
| 2018 | $3,937 | $286,100 | $198,600 | $87,500 |
| 2017 | $3,693 | $268,000 | $180,500 | $87,500 |
| 2016 | $3,603 | $248,500 | $180,500 | $68,000 |
| 2015 | $3,354 | $231,500 | $166,600 | $64,900 |
Source: Public Records
Map
Nearby Homes
- 807 Salem St
- 1 Ingalls Terrace
- 37 Locust St
- 67 Brook Dr
- 344 Broadway
- 14 Carpenter Rd
- 5 Otter Pond Rd
- 6 Longbow Rd
- 1100 Salem St Unit 58
- 1100 Salem St Unit 46
- 1100 Salem St Unit 93
- 1100 Salem St Unit 75
- 7 Timberhill Ln
- 12 Casco Rd
- 63 Crooker Dr
- 159 Judge Rd
- 14 Rockwood Rd
- 714 Lynnfield St
- 10 Ralph Rd
- 1303 Foxwood Cir