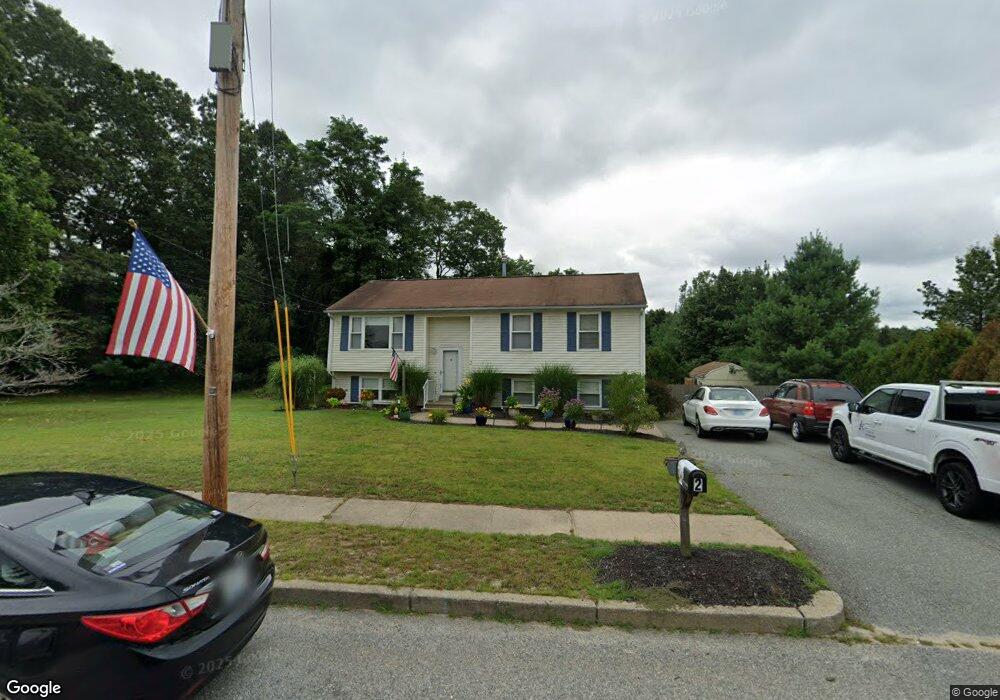
2 Sycamore Dr Coventry, RI 02816
Estimated Value: $427,000 - $492,000
3
Beds
1
Bath
1,086
Sq Ft
$430/Sq Ft
Est. Value
About This Home
This home is located at 2 Sycamore Dr, Coventry, RI 02816 and is currently estimated at $466,444, approximately $429 per square foot. 2 Sycamore Dr is a home located in Kent County with nearby schools including Alan Shawn Feinstein Ms Of Cov, Coventry High School, and Father John V. Doyle School.
Ownership History
Date
Name
Owned For
Owner Type
Purchase Details
Closed on
Jan 19, 2022
Sold by
Houlihan Michael J
Bought by
Houlihan Michael J
Current Estimated Value
Purchase Details
Closed on
Oct 13, 2004
Sold by
Fortin Mark G and Fortin Cheryl L
Bought by
Houlihan Michael and Houlihan Chrissa L
Home Financials for this Owner
Home Financials are based on the most recent Mortgage that was taken out on this home.
Original Mortgage
$260,905
Interest Rate
5.8%
Mortgage Type
Purchase Money Mortgage
Purchase Details
Closed on
Jun 27, 2003
Sold by
Wilson Donald P and Wilson Jayna R
Bought by
Fortin Mark G and Fortin Cheryl L
Home Financials for this Owner
Home Financials are based on the most recent Mortgage that was taken out on this home.
Original Mortgage
$192,000
Interest Rate
5.53%
Purchase Details
Closed on
May 18, 1998
Sold by
Stevenson Ian and Stevenson Kiersten
Bought by
Wilson Donald P and Fontaine Jayna R
Home Financials for this Owner
Home Financials are based on the most recent Mortgage that was taken out on this home.
Original Mortgage
$107,100
Interest Rate
7.08%
Purchase Details
Closed on
May 17, 1996
Sold by
Kentco Dev Inc
Bought by
Stevenson Ian and Stevenson Kiersten
Home Financials for this Owner
Home Financials are based on the most recent Mortgage that was taken out on this home.
Original Mortgage
$107,000
Interest Rate
7.77%
Create a Home Valuation Report for This Property
The Home Valuation Report is an in-depth analysis detailing your home's value as well as a comparison with similar homes in the area
Purchase History
| Date | Buyer | Sale Price | Title Company |
|---|---|---|---|
| Houlihan Michael J | -- | None Available | |
| Houlihan Michael | $265,000 | -- | |
| Fortin Mark G | $244,000 | -- | |
| Wilson Donald P | $119,000 | -- | |
| Stevenson Ian | $118,000 | -- |
Source: Public Records
Mortgage History
| Date | Status | Borrower | Loan Amount |
|---|---|---|---|
| Previous Owner | Stevenson Ian | $260,905 | |
| Previous Owner | Stevenson Ian | $192,000 | |
| Previous Owner | Stevenson Ian | $107,100 | |
| Previous Owner | Stevenson Ian | $107,000 |
Source: Public Records
Tax History Compared to Growth
Tax History
| Year | Tax Paid | Tax Assessment Tax Assessment Total Assessment is a certain percentage of the fair market value that is determined by local assessors to be the total taxable value of land and additions on the property. | Land | Improvement |
|---|---|---|---|---|
| 2024 | $5,919 | $373,700 | $148,700 | $225,000 |
| 2023 | $5,729 | $373,700 | $148,700 | $225,000 |
| 2022 | $5,863 | $299,600 | $140,700 | $158,900 |
| 2021 | $5,812 | $299,600 | $140,700 | $158,900 |
| 2020 | $6,663 | $299,600 | $140,700 | $158,900 |
| 2019 | $5,720 | $257,200 | $113,800 | $143,400 |
| 2018 | $5,558 | $257,200 | $113,800 | $143,400 |
| 2017 | $5,396 | $257,200 | $113,800 | $143,400 |
| 2016 | $5,601 | $261,600 | $124,600 | $137,000 |
| 2015 | $5,449 | $261,600 | $124,600 | $137,000 |
| 2014 | $5,335 | $261,600 | $124,600 | $137,000 |
| 2013 | $4,616 | $247,400 | $109,600 | $137,800 |
Source: Public Records
Map
Nearby Homes