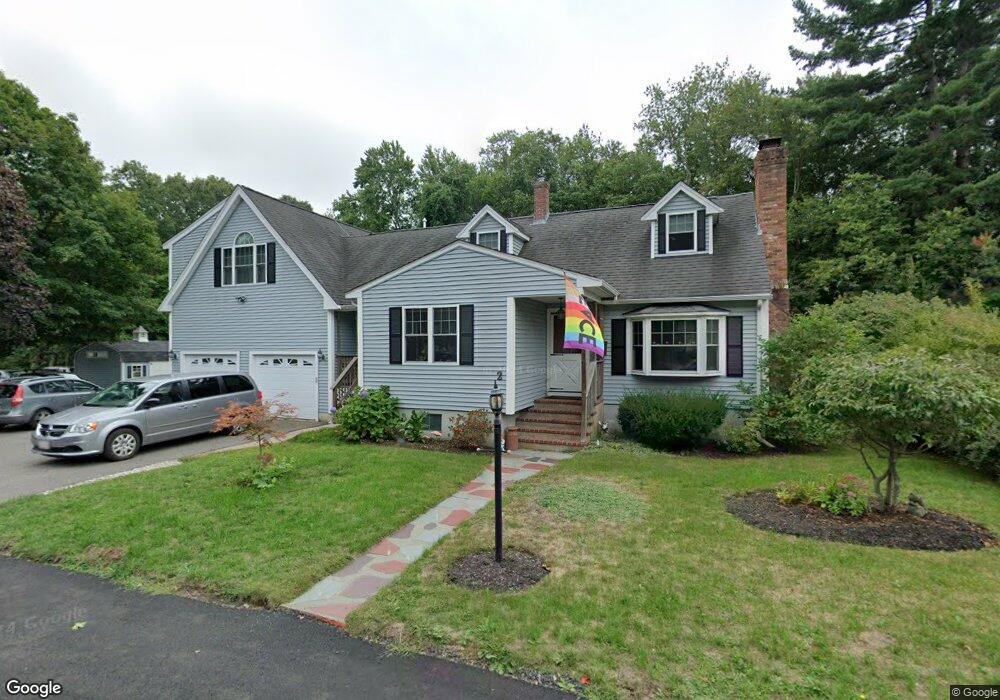
2 Sylvester Rd Natick, MA 01760
Estimated Value: $620,000 - $1,134,000
3
Beds
1
Bath
1,233
Sq Ft
$806/Sq Ft
Est. Value
About This Home
This home is located at 2 Sylvester Rd, Natick, MA 01760 and is currently estimated at $994,411, approximately $806 per square foot. 2 Sylvester Rd is a home located in Middlesex County with nearby schools including Natick High School, J F Kennedy Middle School, and Johnson Elementary School.
Ownership History
Date
Name
Owned For
Owner Type
Purchase Details
Closed on
Aug 22, 2003
Sold by
Cerasuolo Barbara
Bought by
Seymour Alan C and Seymour Barbara J
Current Estimated Value
Home Financials for this Owner
Home Financials are based on the most recent Mortgage that was taken out on this home.
Original Mortgage
$285,000
Outstanding Balance
$124,588
Interest Rate
5.52%
Mortgage Type
Purchase Money Mortgage
Estimated Equity
$869,823
Create a Home Valuation Report for This Property
The Home Valuation Report is an in-depth analysis detailing your home's value as well as a comparison with similar homes in the area
Home Values in the Area
Average Home Value in this Area
Purchase History
| Date | Buyer | Sale Price | Title Company |
|---|---|---|---|
| Seymour Alan C | $356,500 | -- |
Source: Public Records
Mortgage History
| Date | Status | Borrower | Loan Amount |
|---|---|---|---|
| Open | Seymour Alan C | $285,000 |
Source: Public Records
Tax History Compared to Growth
Tax History
| Year | Tax Paid | Tax Assessment Tax Assessment Total Assessment is a certain percentage of the fair market value that is determined by local assessors to be the total taxable value of land and additions on the property. | Land | Improvement |
|---|---|---|---|---|
| 2025 | $10,339 | $864,500 | $430,500 | $434,000 |
| 2024 | $9,913 | $808,600 | $405,200 | $403,400 |
| 2023 | $8,934 | $706,800 | $389,500 | $317,300 |
| 2022 | $8,718 | $653,500 | $353,600 | $299,900 |
| 2021 | $8,339 | $612,700 | $333,400 | $279,300 |
| 2020 | $8,133 | $597,600 | $318,300 | $279,300 |
| 2019 | $7,595 | $597,600 | $318,300 | $279,300 |
| 2018 | $7,776 | $595,900 | $303,100 | $292,800 |
| 2017 | $7,371 | $546,400 | $258,900 | $287,500 |
| 2016 | $7,096 | $522,900 | $237,900 | $285,000 |
| 2015 | $6,859 | $496,300 | $237,900 | $258,400 |
Source: Public Records
Map
Nearby Homes
- 1 Fern St
- 91 Speen St
- 16 West St
- 4 Sylvia Ave
- 216-218 S Main St
- 46 Silver Hill Ln Unit 1
- 26 Walden Dr Unit 4
- 40 Silver Hill Ln Unit 4
- 25 Forest Ave
- 9 Silver Hill Ln Unit 19
- 32 Silver Hill Ln Unit 1
- 47 High St
- 105 N Main St
- 12 Walden Dr Unit 19
- 6 Ambler Ct
- 2 Lodge Rd
- 16 Wayside Rd Unit 14
- 16 Wayside Rd
- 8 Floral Avenue Extension
- 58 W Central St