Estimated Value: $635,000 - $718,401
3
Beds
5
Baths
2,504
Sq Ft
$273/Sq Ft
Est. Value
About This Home
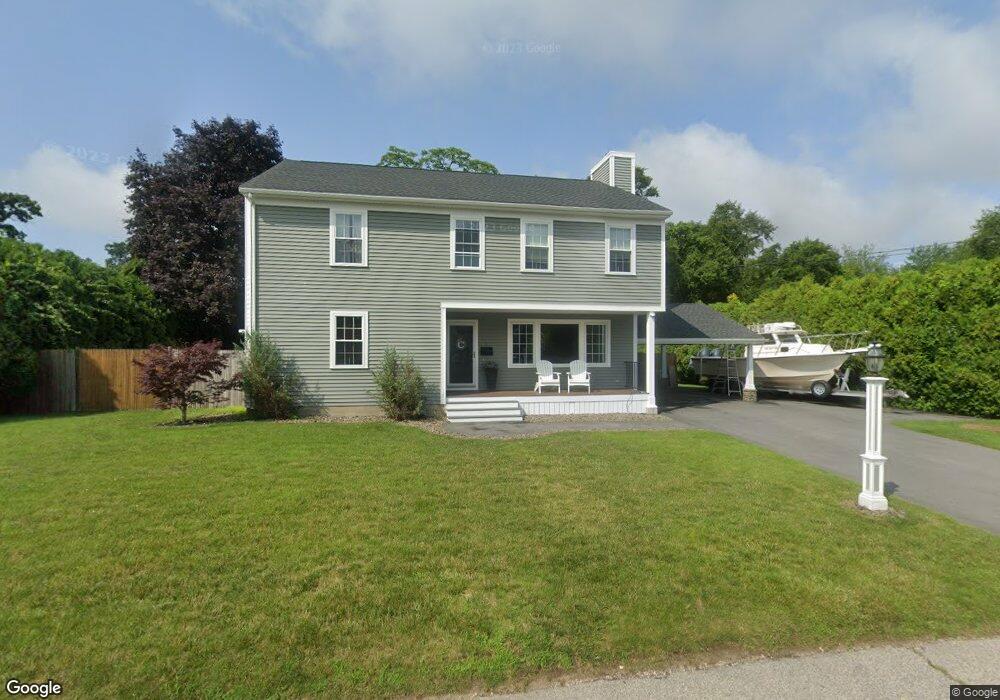
This home is located at 2 Terry Dr, South Dartmouth, MA 02748 and is currently estimated at $684,600, approximately $273 per square foot. 2 Terry Dr is a home located in Bristol County with nearby schools including Dartmouth High School and St. Teresa of Calcutta School.
Ownership History
Date
Name
Owned For
Owner Type
Purchase Details
Closed on
Jun 15, 2012
Sold by
Carbral Ryan E and Carbral Lindsey M
Bought by
Carbral Ryan E
Current Estimated Value
Purchase Details
Closed on
Aug 14, 2009
Sold by
Souza Ronald R and Souza Raymond
Bought by
Cabral Ryan E and Cabral Sylvia Lindsey
Home Financials for this Owner
Home Financials are based on the most recent Mortgage that was taken out on this home.
Original Mortgage
$232,750
Interest Rate
5.36%
Mortgage Type
Purchase Money Mortgage
Purchase Details
Closed on
May 19, 2008
Sold by
Souza Olive
Bought by
Souza Olive and Souza Raymond
Create a Home Valuation Report for This Property
The Home Valuation Report is an in-depth analysis detailing your home's value as well as a comparison with similar homes in the area
Home Values in the Area
Average Home Value in this Area
Purchase History
| Date | Buyer | Sale Price | Title Company |
|---|---|---|---|
| Carbral Ryan E | -- | -- | |
| Cabral Ryan E | $245,000 | -- | |
| Souza Olive | -- | -- |
Source: Public Records
Mortgage History
| Date | Status | Borrower | Loan Amount |
|---|---|---|---|
| Previous Owner | Souza Olive | $232,750 |
Source: Public Records
Tax History Compared to Growth
Tax History
| Year | Tax Paid | Tax Assessment Tax Assessment Total Assessment is a certain percentage of the fair market value that is determined by local assessors to be the total taxable value of land and additions on the property. | Land | Improvement |
|---|---|---|---|---|
| 2025 | $4,642 | $539,100 | $177,800 | $361,300 |
| 2024 | $4,478 | $515,300 | $169,600 | $345,700 |
| 2023 | $4,402 | $480,000 | $157,300 | $322,700 |
| 2022 | $4,070 | $411,100 | $150,500 | $260,600 |
| 2021 | $3,990 | $385,100 | $132,800 | $252,300 |
| 2020 | $3,981 | $383,500 | $132,800 | $250,700 |
| 2019 | $3,896 | $374,600 | $132,800 | $241,800 |
| 2018 | $4,166 | $355,800 | $132,800 | $223,000 |
| 2017 | $3,443 | $343,600 | $125,300 | $218,300 |
| 2016 | $2,374 | $233,700 | $125,300 | $108,400 |
| 2015 | $2,301 | $226,900 | $117,100 | $109,800 |
| 2014 | $2,182 | $213,700 | $106,200 | $107,500 |
Source: Public Records
Map
Nearby Homes