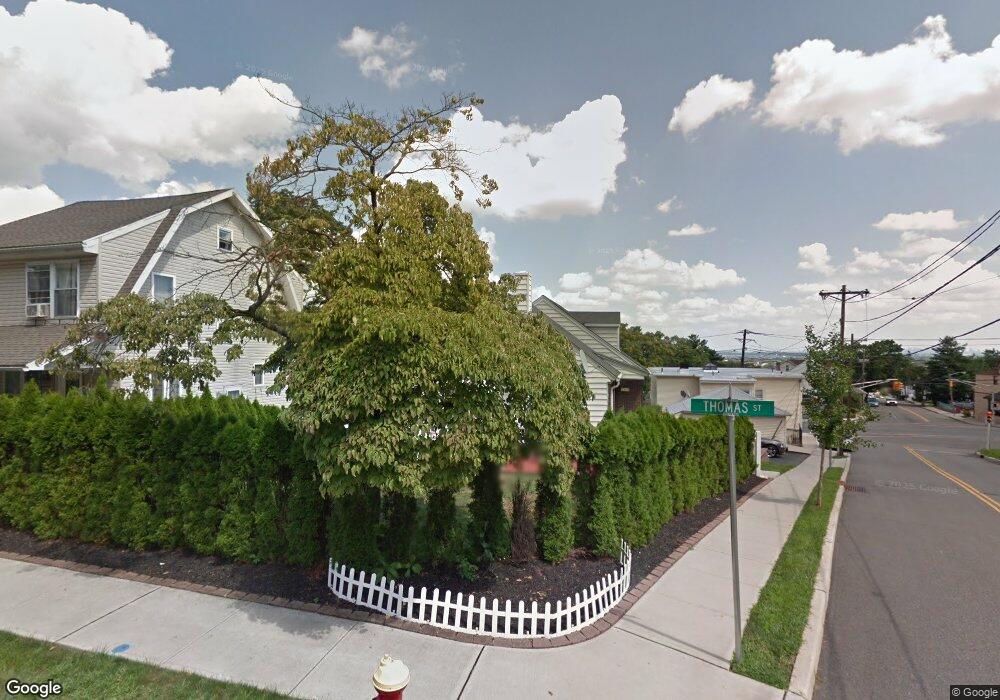
2 Thomas St Clifton, NJ 07013
Albion NeighborhoodEstimated Value: $474,573 - $603,000
Studio
--
Bath
1,573
Sq Ft
$358/Sq Ft
Est. Value
About This Home
This home is located at 2 Thomas St, Clifton, NJ 07013 and is currently estimated at $563,893, approximately $358 per square foot. 2 Thomas St is a home located in Passaic County with nearby schools including Clifton High School and Paterson Arts And Science Charter School.
Ownership History
Date
Name
Owned For
Owner Type
Purchase Details
Closed on
Apr 23, 2005
Sold by
Botas Ozlem Akbay
Bought by
Botas Murat and Botas Ozlem Akbay
Current Estimated Value
Purchase Details
Closed on
Jun 30, 1997
Sold by
Ambrogio Joseph and Ambrogio Elizabeth
Bought by
Botas Ozlem Akbay and Akbay Faith
Home Financials for this Owner
Home Financials are based on the most recent Mortgage that was taken out on this home.
Original Mortgage
$147,000
Interest Rate
7.86%
Create a Home Valuation Report for This Property
The Home Valuation Report is an in-depth analysis detailing your home's value as well as a comparison with similar homes in the area
Home Values in the Area
Average Home Value in this Area
Purchase History
| Date | Buyer | Sale Price | Title Company |
|---|---|---|---|
| Botas Murat | -- | -- | |
| Botas Ozlem Akbay | $149,000 | -- |
Source: Public Records
Mortgage History
| Date | Status | Borrower | Loan Amount |
|---|---|---|---|
| Previous Owner | Botas Ozlem Akbay | $147,000 |
Source: Public Records
Tax History
| Year | Tax Paid | Tax Assessment Tax Assessment Total Assessment is a certain percentage of the fair market value that is determined by local assessors to be the total taxable value of land and additions on the property. | Land | Improvement |
|---|---|---|---|---|
| 2025 | $8,928 | $150,400 | $71,100 | $79,300 |
| 2024 | $8,714 | $150,400 | $71,100 | $79,300 |
| 2022 | $8,485 | $148,600 | $71,100 | $77,500 |
| 2021 | $8,136 | $148,600 | $71,100 | $77,500 |
| 2020 | $8,163 | $148,600 | $71,100 | $77,500 |
| 2019 | $8,105 | $148,600 | $71,100 | $77,500 |
| 2018 | $8,059 | $148,600 | $71,100 | $77,500 |
| 2017 | $7,971 | $148,600 | $71,100 | $77,500 |
| 2016 | $7,816 | $148,600 | $71,100 | $77,500 |
| 2015 | $7,741 | $148,600 | $71,100 | $77,500 |
| 2014 | $7,582 | $148,600 | $71,100 | $77,500 |
Source: Public Records
Map
Nearby Homes
- 21 Thomas St
- 113 Valley Rd
- 117 Valley Rd
- 120 Fenner Ave
- 110 Gourley Ave
- 144 Silleck St
- 445 Marshall St
- 249 Silleck St
- 439 Marshall St
- 235 Dakota St Unit 10
- 43 Dewey Ave
- 43 Dewey St
- 229-235 Marshall St
- 65 Levine St
- 28 Butler St
- 80 Newark Ave
- 148 Barclay St
- 35-37 Montclair Ave
- 92 Bloomfield Ave
- 38 Sherwood St
Your Personal Tour Guide
Ask me questions while you tour the home.