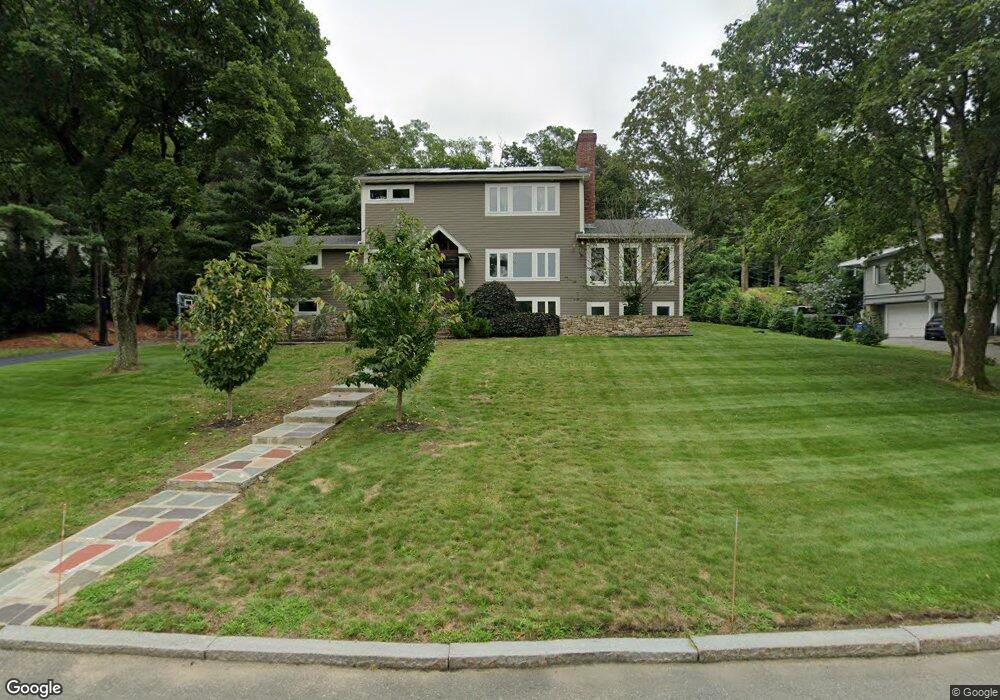
2 Thornberry Rd Winchester, MA 01890
West Side NeighborhoodEstimated Value: $1,457,000 - $1,867,000
3
Beds
3
Baths
1,825
Sq Ft
$924/Sq Ft
Est. Value
About This Home
This home is located at 2 Thornberry Rd, Winchester, MA 01890 and is currently estimated at $1,686,505, approximately $924 per square foot. 2 Thornberry Rd is a home located in Middlesex County with nearby schools including Vinson-Owen Elementary School, McCall Middle School, and Winchester High School.
Ownership History
Date
Name
Owned For
Owner Type
Purchase Details
Closed on
Nov 30, 2009
Sold by
Abraham Stephanie
Bought by
Parseghian Shant A and Parseghian Reem R
Current Estimated Value
Home Financials for this Owner
Home Financials are based on the most recent Mortgage that was taken out on this home.
Original Mortgage
$491,850
Outstanding Balance
$321,142
Interest Rate
4.92%
Mortgage Type
Purchase Money Mortgage
Estimated Equity
$1,365,363
Purchase Details
Closed on
Jun 25, 2007
Sold by
Ruth M
Bought by
John
Create a Home Valuation Report for This Property
The Home Valuation Report is an in-depth analysis detailing your home's value as well as a comparison with similar homes in the area
Home Values in the Area
Average Home Value in this Area
Purchase History
| Date | Buyer | Sale Price | Title Company |
|---|---|---|---|
| Parseghian Shant A | $546,500 | -- | |
| John | -- | -- |
Source: Public Records
Mortgage History
| Date | Status | Borrower | Loan Amount |
|---|---|---|---|
| Open | Parseghian Shant A | $491,850 |
Source: Public Records
Tax History Compared to Growth
Tax History
| Year | Tax Paid | Tax Assessment Tax Assessment Total Assessment is a certain percentage of the fair market value that is determined by local assessors to be the total taxable value of land and additions on the property. | Land | Improvement |
|---|---|---|---|---|
| 2025 | $154 | $1,386,100 | $799,400 | $586,700 |
| 2024 | $15,248 | $1,345,800 | $759,500 | $586,300 |
| 2023 | $0 | $1,165,400 | $659,500 | $505,900 |
| 2022 | $0 | $1,067,400 | $599,600 | $467,800 |
| 2021 | $12,668 | $987,400 | $519,600 | $467,800 |
| 2020 | $12,110 | $977,400 | $509,600 | $467,800 |
| 2019 | $11,232 | $927,500 | $459,700 | $467,800 |
| 2018 | $10,959 | $899,000 | $437,700 | $461,300 |
| 2017 | $10,639 | $866,400 | $437,700 | $428,700 |
| 2016 | $10,026 | $858,400 | $429,700 | $428,700 |
| 2015 | $8,112 | $668,200 | $399,700 | $268,500 |
| 2014 | $7,668 | $605,700 | $389,700 | $216,000 |
Source: Public Records
Map
Nearby Homes
- 7 Thornberry Rd
- 41 Squire Rd
- 20 Amberwood Dr
- 26 Berkshire Dr
- 14 Nassau Dr
- 19 Gershon Way Unit 1
- 19 Gershon Way
- 19 Cox Rd
- 7 Grace Rd
- 5 Azalea Rd
- 257 High St
- 21 Derby Dr Unit 21
- 276 High St
- 189 High St
- 500 Lexington St Unit 6
- 22 Tyler Rd
- 7 Wainwright Rd Unit 118
- 273 Cambridge Rd Unit 202
- 139 High St
- 30 Whipple Rd