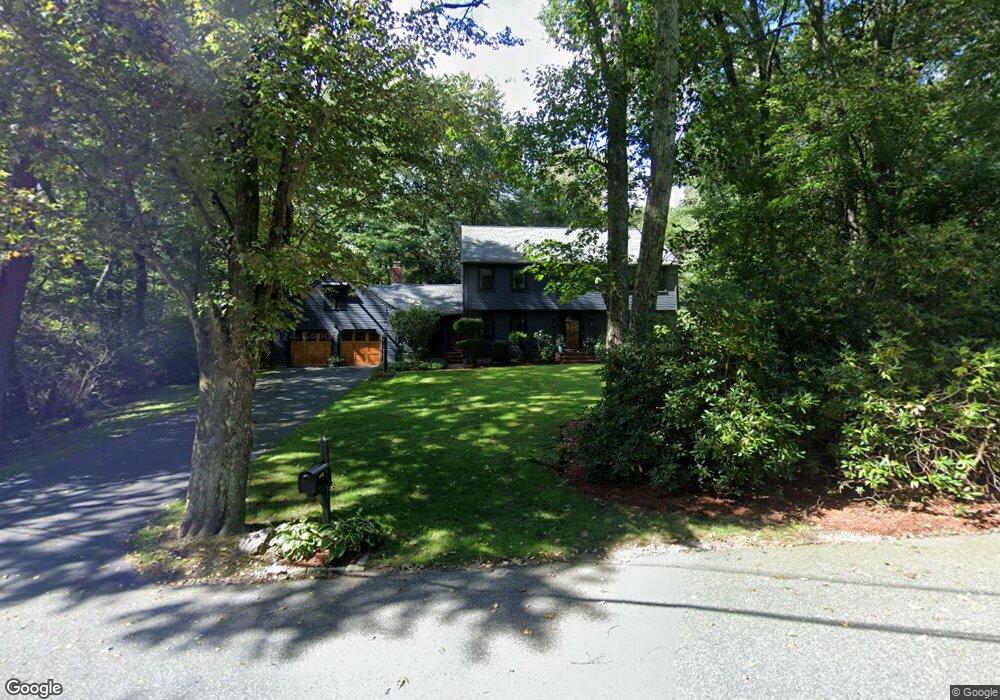
2 Thoroughbred Ln Sherborn, MA 01770
Estimated Value: $1,132,495 - $1,251,000
4
Beds
3
Baths
3,112
Sq Ft
$381/Sq Ft
Est. Value
About This Home
This home is located at 2 Thoroughbred Ln, Sherborn, MA 01770 and is currently estimated at $1,186,624, approximately $381 per square foot. 2 Thoroughbred Ln is a home located in Middlesex County with nearby schools including Pine Hill Elementary School, Dover-Sherborn Regional Middle School, and Dover-Sherborn Regional High School.
Ownership History
Date
Name
Owned For
Owner Type
Purchase Details
Closed on
Mar 24, 1995
Sold by
Salmon Edward A and Salmon Esther W
Bought by
Dauria Alexander D and Dauria Mary P
Current Estimated Value
Home Financials for this Owner
Home Financials are based on the most recent Mortgage that was taken out on this home.
Original Mortgage
$130,000
Interest Rate
8.78%
Mortgage Type
Purchase Money Mortgage
Create a Home Valuation Report for This Property
The Home Valuation Report is an in-depth analysis detailing your home's value as well as a comparison with similar homes in the area
Home Values in the Area
Average Home Value in this Area
Purchase History
| Date | Buyer | Sale Price | Title Company |
|---|---|---|---|
| Dauria Alexander D | $397,000 | -- |
Source: Public Records
Mortgage History
| Date | Status | Borrower | Loan Amount |
|---|---|---|---|
| Open | Dauria Alexander D | $97,500 | |
| Closed | Dauria Alexander D | $130,000 | |
| Closed | Dauria Alexander D | $100,000 | |
| Closed | Dauria Alexander D | $130,000 |
Source: Public Records
Tax History
| Year | Tax Paid | Tax Assessment Tax Assessment Total Assessment is a certain percentage of the fair market value that is determined by local assessors to be the total taxable value of land and additions on the property. | Land | Improvement |
|---|---|---|---|---|
| 2025 | $15,806 | $953,300 | $428,500 | $524,800 |
| 2024 | $14,938 | $881,300 | $428,500 | $452,800 |
| 2023 | $13,828 | $767,800 | $428,500 | $339,300 |
| 2022 | $13,039 | $685,200 | $418,900 | $266,300 |
| 2021 | $12,314 | $664,800 | $418,900 | $245,900 |
| 2020 | $12,937 | $664,800 | $418,900 | $245,900 |
| 2019 | $12,981 | $661,600 | $418,900 | $242,700 |
| 2018 | $5,707 | $653,700 | $418,900 | $234,800 |
| 2017 | $12,804 | $625,800 | $418,900 | $206,900 |
| 2016 | $12,772 | $620,900 | $418,900 | $202,000 |
| 2015 | $12,592 | $619,700 | $414,100 | $205,600 |
| 2014 | $12,082 | $594,000 | $395,100 | $198,900 |
Source: Public Records
Map
Nearby Homes
- 14 Sewall Brook Ln
- 5 Farm Rd
- 32 Cider Hill Ln
- 174 S Main St
- 65 Farm Road Lot 6
- 90 Maple St
- 20 Nason Hill Rd
- 137 Lake St
- 59 Spywood Rd
- 14 Fiske Pond Rd
- 00000 S Main St and Bullard St
- 27 Spywood Rd
- 21 Spywood Rd
- 615 Mayflower Landing
- 9 Adams Ln Unit 9
- 114 Farm St
- 81 Brush Hill Rd
- 103 Farm St
- 6 Hopewell Farm Rd
- 1 Adams Ln Unit 1
Your Personal Tour Guide
Ask me questions while you tour the home.