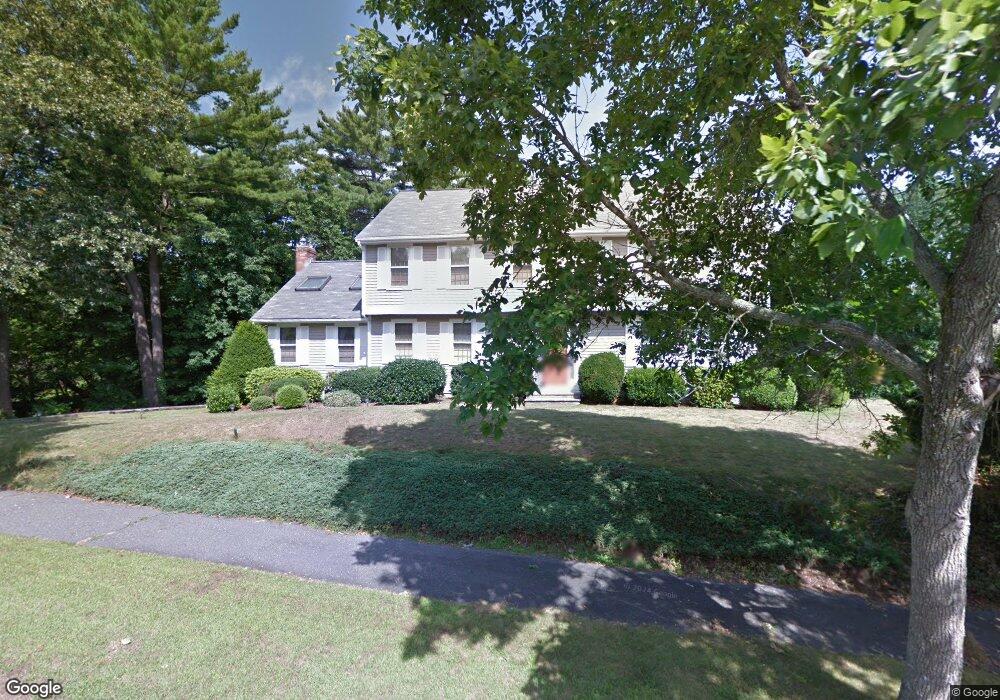
2 Tidd Cir Lexington, MA 02420
North Lexington NeighborhoodEstimated Value: $1,709,024 - $1,974,000
4
Beds
3
Baths
3,010
Sq Ft
$617/Sq Ft
Est. Value
About This Home
This home is located at 2 Tidd Cir, Lexington, MA 02420 and is currently estimated at $1,856,006, approximately $616 per square foot. 2 Tidd Cir is a home located in Middlesex County with nearby schools including Joseph Estabrook Elementary School, William Diamond Middle School, and Lexington High School.
Ownership History
Date
Name
Owned For
Owner Type
Purchase Details
Closed on
Dec 1, 1999
Sold by
Duff Tidd Circle Nt
Bought by
Field Edwin L and Field Carolyn C
Current Estimated Value
Create a Home Valuation Report for This Property
The Home Valuation Report is an in-depth analysis detailing your home's value as well as a comparison with similar homes in the area
Home Values in the Area
Average Home Value in this Area
Purchase History
| Date | Buyer | Sale Price | Title Company |
|---|---|---|---|
| Field Edwin L | $595,500 | -- |
Source: Public Records
Mortgage History
| Date | Status | Borrower | Loan Amount |
|---|---|---|---|
| Previous Owner | Field Edwin L | $100,000 | |
| Previous Owner | Field Edwin L | $173,900 | |
| Previous Owner | Field Edwin L | $174,500 |
Source: Public Records
Tax History
| Year | Tax Paid | Tax Assessment Tax Assessment Total Assessment is a certain percentage of the fair market value that is determined by local assessors to be the total taxable value of land and additions on the property. | Land | Improvement |
|---|---|---|---|---|
| 2025 | $20,131 | $1,646,000 | $745,000 | $901,000 |
| 2024 | $19,723 | $1,610,000 | $710,000 | $900,000 |
| 2023 | $19,370 | $1,490,000 | $645,000 | $845,000 |
| 2022 | $18,175 | $1,317,000 | $587,000 | $730,000 |
| 2021 | $17,800 | $1,237,000 | $559,000 | $678,000 |
| 2020 | $17,183 | $1,223,000 | $559,000 | $664,000 |
| 2019 | $16,492 | $1,168,000 | $532,000 | $636,000 |
| 2018 | $16,173 | $1,131,000 | $507,000 | $624,000 |
| 2017 | $15,606 | $1,077,000 | $491,000 | $586,000 |
| 2016 | $15,126 | $1,036,000 | $452,000 | $584,000 |
| 2015 | $14,607 | $983,000 | $418,000 | $565,000 |
| 2014 | $12,827 | $827,000 | $370,000 | $457,000 |
Source: Public Records
Map
Nearby Homes
Your Personal Tour Guide
Ask me questions while you tour the home.