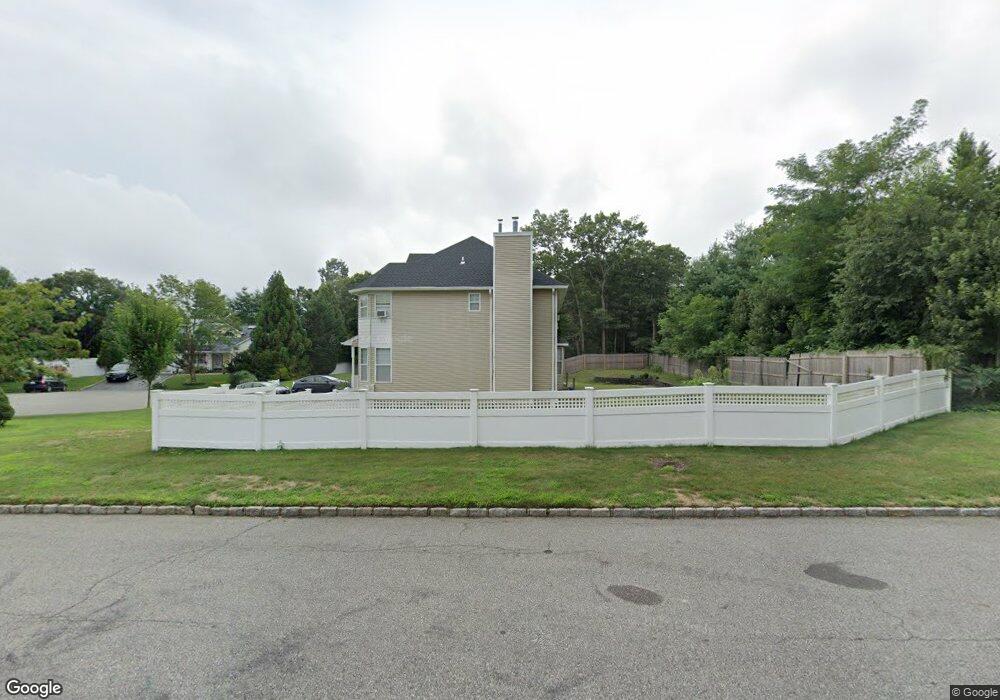
2 Unity Ct Nesconset, NY 11767
Estimated Value: $1,054,025 - $1,292,000
4
Beds
3
Baths
2,980
Sq Ft
$403/Sq Ft
Est. Value
About This Home
This home is located at 2 Unity Ct, Nesconset, NY 11767 and is currently estimated at $1,200,006, approximately $402 per square foot. 2 Unity Ct is a home located in Suffolk County with nearby schools including Mills Pond Elementary School and St Patrick Elementary School.
Ownership History
Date
Name
Owned For
Owner Type
Purchase Details
Closed on
Aug 22, 2003
Sold by
Lodin Rohullah and Lodin Laila
Bought by
Lee Tom H and Hu Grace
Current Estimated Value
Home Financials for this Owner
Home Financials are based on the most recent Mortgage that was taken out on this home.
Original Mortgage
$300,000
Outstanding Balance
$138,716
Interest Rate
6.31%
Mortgage Type
Purchase Money Mortgage
Estimated Equity
$1,061,290
Purchase Details
Closed on
Jun 6, 2000
Sold by
Valmont Construction Co Inc
Bought by
Lodin Rohullah and Lodin Laila
Create a Home Valuation Report for This Property
The Home Valuation Report is an in-depth analysis detailing your home's value as well as a comparison with similar homes in the area
Home Values in the Area
Average Home Value in this Area
Purchase History
| Date | Buyer | Sale Price | Title Company |
|---|---|---|---|
| Lee Tom H | $575,500 | -- | |
| Lodin Rohullah | $376,000 | -- |
Source: Public Records
Mortgage History
| Date | Status | Borrower | Loan Amount |
|---|---|---|---|
| Open | Lee Tom H | $300,000 |
Source: Public Records
Tax History
| Year | Tax Paid | Tax Assessment Tax Assessment Total Assessment is a certain percentage of the fair market value that is determined by local assessors to be the total taxable value of land and additions on the property. | Land | Improvement |
|---|---|---|---|---|
| 2024 | $19,838 | $8,000 | $410 | $7,590 |
| 2023 | $19,837 | $7,700 | $410 | $7,290 |
| 2022 | $16,508 | $7,700 | $410 | $7,290 |
| 2021 | $16,508 | $7,700 | $410 | $7,290 |
| 2020 | $18,102 | $7,700 | $410 | $7,290 |
| 2019 | $18,102 | $0 | $0 | $0 |
| 2018 | -- | $7,700 | $410 | $7,290 |
| 2017 | $16,860 | $7,700 | $410 | $7,290 |
| 2016 | $16,665 | $7,700 | $410 | $7,290 |
| 2015 | -- | $7,700 | $410 | $7,290 |
| 2014 | -- | $7,700 | $410 | $7,290 |
Source: Public Records
Map
Nearby Homes
- 105 Browns Rd
- 56 Snowdance Ln Unit 76
- 29 Snowdance Ln
- 148 S Hillside Ave
- 55 Tiffany Way Unit 16
- 155 Alexander Ave
- 8 Brookstan Rd
- 120 Cambon Ave
- 7 Sara Ct
- 9 Storybook Ln
- 1 Yardley Ln
- 23 Dellmarie Ln
- 2475 Nesconset Hwy
- 88 Astor Ave
- 1 6th St
- 5 Louis Place
- 3 Louis Place
- 48 Roy Dr
- 0 Middle Country Rd
- 60 Parsnip Pond Rd
Your Personal Tour Guide
Ask me questions while you tour the home.