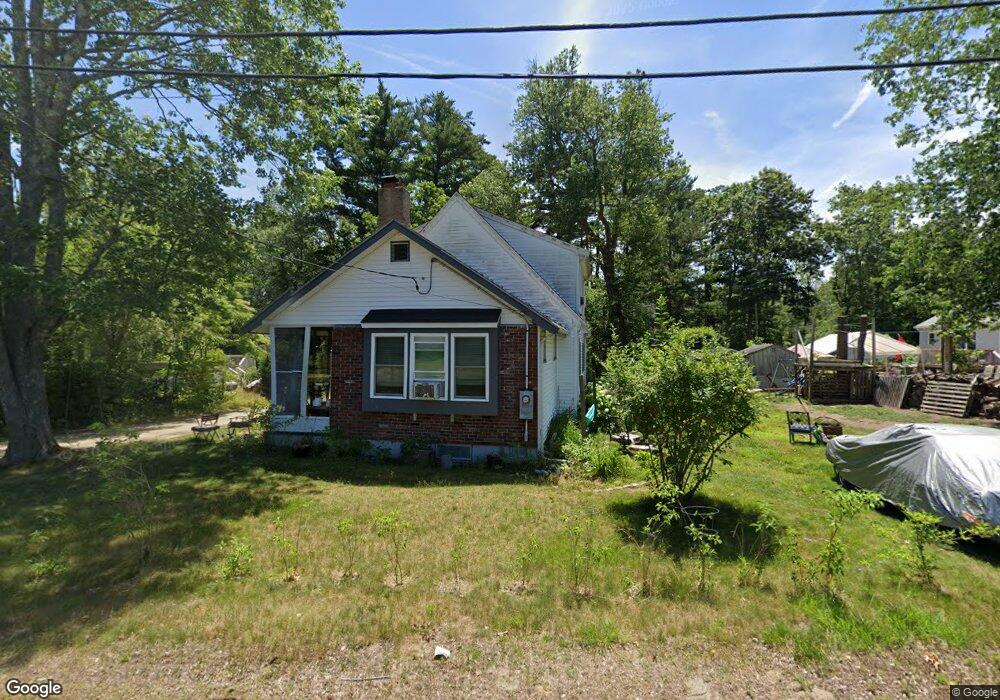
2 Upton St Hanson, MA 02341
Estimated Value: $396,000 - $495,000
2
Beds
1
Bath
900
Sq Ft
$497/Sq Ft
Est. Value
About This Home
This home is located at 2 Upton St, Hanson, MA 02341 and is currently estimated at $446,893, approximately $496 per square foot. 2 Upton St is a home located in Plymouth County.
Ownership History
Date
Name
Owned For
Owner Type
Purchase Details
Closed on
Aug 23, 2021
Sold by
Noonan Steven
Bought by
Noonan Steven M and Noonan Jamie M
Current Estimated Value
Home Financials for this Owner
Home Financials are based on the most recent Mortgage that was taken out on this home.
Original Mortgage
$131,500
Outstanding Balance
$108,896
Interest Rate
2.8%
Mortgage Type
New Conventional
Estimated Equity
$337,997
Purchase Details
Closed on
Apr 30, 2010
Sold by
Obrien Mary Agnes Est and Kelley
Bought by
Noonan Steven
Home Financials for this Owner
Home Financials are based on the most recent Mortgage that was taken out on this home.
Original Mortgage
$147,283
Interest Rate
5.37%
Mortgage Type
FHA
Create a Home Valuation Report for This Property
The Home Valuation Report is an in-depth analysis detailing your home's value as well as a comparison with similar homes in the area
Home Values in the Area
Average Home Value in this Area
Purchase History
| Date | Buyer | Sale Price | Title Company |
|---|---|---|---|
| Noonan Steven M | -- | None Available | |
| Noonan Steven M | -- | None Available | |
| Noonan Steven | $150,000 | -- | |
| Noonan Steven | $150,000 | -- |
Source: Public Records
Mortgage History
| Date | Status | Borrower | Loan Amount |
|---|---|---|---|
| Open | Noonan Steven M | $131,500 | |
| Closed | Noonan Steven M | $131,500 | |
| Previous Owner | Noonan Steven | $147,283 |
Source: Public Records
Tax History
| Year | Tax Paid | Tax Assessment Tax Assessment Total Assessment is a certain percentage of the fair market value that is determined by local assessors to be the total taxable value of land and additions on the property. | Land | Improvement |
|---|---|---|---|---|
| 2025 | $4,414 | $329,900 | $141,700 | $188,200 |
| 2024 | $4,288 | $320,500 | $137,700 | $182,800 |
| 2023 | $4,209 | $296,800 | $137,700 | $159,100 |
| 2022 | $4,071 | $269,800 | $125,100 | $144,700 |
| 2021 | $3,598 | $238,300 | $120,300 | $118,000 |
| 2020 | $3,369 | $220,600 | $116,200 | $104,400 |
| 2019 | $3,136 | $201,900 | $106,900 | $95,000 |
| 2018 | $3,054 | $192,900 | $102,800 | $90,100 |
| 2017 | $2,852 | $178,500 | $91,300 | $87,200 |
| 2016 | $2,914 | $176,100 | $91,300 | $84,800 |
| 2015 | $2,753 | $172,900 | $91,300 | $81,600 |
Source: Public Records
Map
Nearby Homes
- 115 Waltham St
- 0 Union Park St
- 102 Leon Ct
- 553 Monponsett St
- 0 Thompson St
- 1 Poplar Rd
- 318 South St
- 25 Lawrence Rd
- 143 Plymouth St
- 37 Annawon Dr
- 102 Twin Lakes Dr
- 343 Monponsett St
- 131 Elmer St
- 151 Plymouth St Unit 151A
- 265 Monponsett St Unit 2210
- 265 Monponsett St Unit 2203
- 266 Monponsett St Unit 1103
- 266 Monponsett St Unit 1105
- 266 Monponsett St Unit 1201
- 266 Monponsett St Unit 1208
Your Personal Tour Guide
Ask me questions while you tour the home.