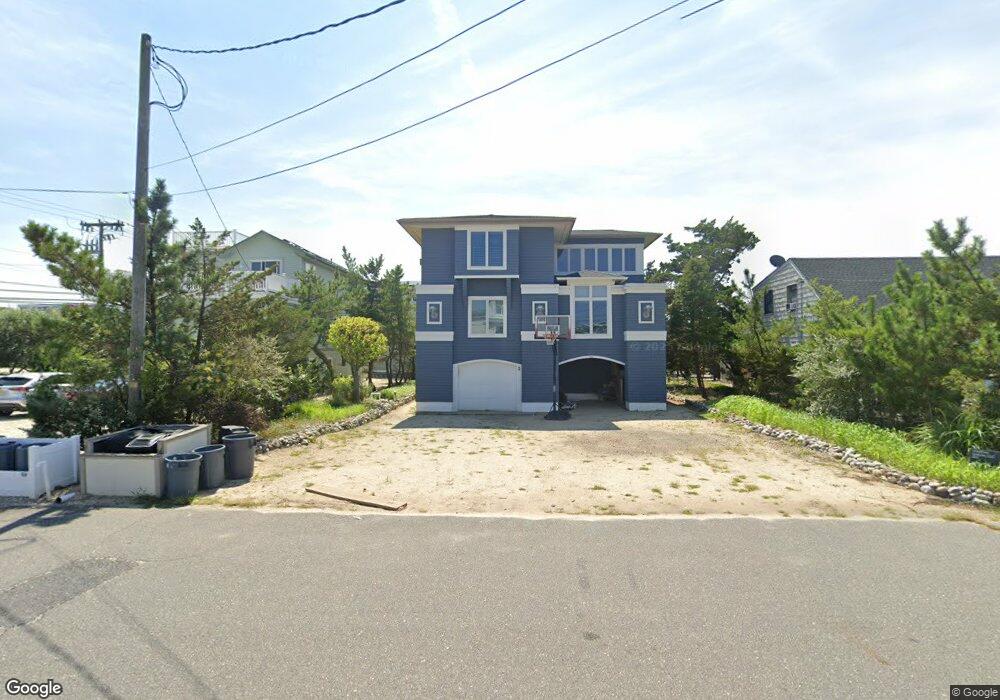
2 W 29th Ave Barnegat Light, NJ 08006
Long Beach Island NeighborhoodEstimated Value: $1,840,461 - $2,207,000
4
Beds
3
Baths
6,066
Sq Ft
$326/Sq Ft
Est. Value
About This Home
This home is located at 2 W 29th Ave, Barnegat Light, NJ 08006 and is currently estimated at $1,979,115, approximately $326 per square foot. 2 W 29th Ave is a home with nearby schools including Ethel A. Jacobsen Elementary School, Long Beach Island Grade School, and Southern Regional Middle School.
Ownership History
Date
Name
Owned For
Owner Type
Purchase Details
Closed on
Oct 24, 2014
Sold by
Poller Edward B
Bought by
Kelsen Family Trust
Current Estimated Value
Home Financials for this Owner
Home Financials are based on the most recent Mortgage that was taken out on this home.
Original Mortgage
$305,000
Outstanding Balance
$230,777
Interest Rate
3.75%
Mortgage Type
Adjustable Rate Mortgage/ARM
Estimated Equity
$1,748,338
Purchase Details
Closed on
Sep 19, 2006
Sold by
Poller Rachel A
Bought by
Poller Edward B
Purchase Details
Closed on
Jul 30, 2004
Sold by
Poller Edward B and Poller Rachel A
Bought by
Poller Rachel A
Purchase Details
Closed on
Jan 31, 2003
Sold by
Mancinelli Fred
Bought by
Poller Edward B and Poller Rachel A
Create a Home Valuation Report for This Property
The Home Valuation Report is an in-depth analysis detailing your home's value as well as a comparison with similar homes in the area
Home Values in the Area
Average Home Value in this Area
Purchase History
| Date | Buyer | Sale Price | Title Company |
|---|---|---|---|
| Kelsen Family Trust | $790,000 | Foundation Title Llc | |
| Poller Edward B | -- | None Available | |
| Poller Rachel A | -- | None Available | |
| Poller Edward B | $1,150,000 | -- |
Source: Public Records
Mortgage History
| Date | Status | Borrower | Loan Amount |
|---|---|---|---|
| Open | Kelsen Family Trust | $305,000 |
Source: Public Records
Tax History Compared to Growth
Tax History
| Year | Tax Paid | Tax Assessment Tax Assessment Total Assessment is a certain percentage of the fair market value that is determined by local assessors to be the total taxable value of land and additions on the property. | Land | Improvement |
|---|---|---|---|---|
| 2025 | $7,963 | $790,000 | $376,400 | $413,600 |
| 2024 | $7,039 | $790,000 | $376,400 | $413,600 |
| 2023 | $6,533 | $790,000 | $376,400 | $413,600 |
| 2022 | $6,533 | $790,000 | $376,400 | $413,600 |
| 2021 | $7,031 | $790,000 | $376,400 | $413,600 |
| 2020 | $7,134 | $790,000 | $376,400 | $413,600 |
| 2019 | $6,873 | $790,000 | $376,400 | $413,600 |
| 2018 | $6,755 | $790,000 | $376,400 | $413,600 |
| 2017 | $6,992 | $790,000 | $376,400 | $413,600 |
| 2016 | $9,536 | $1,106,300 | $395,300 | $711,000 |
| 2015 | $9,193 | $1,106,300 | $395,300 | $711,000 |
| 2014 | $10,005 | $1,106,800 | $395,300 | $711,500 |
Source: Public Records
Map
Nearby Homes