Estimated Value: $59,000 - $167,000
--
Bed
1
Bath
902
Sq Ft
$110/Sq Ft
Est. Value
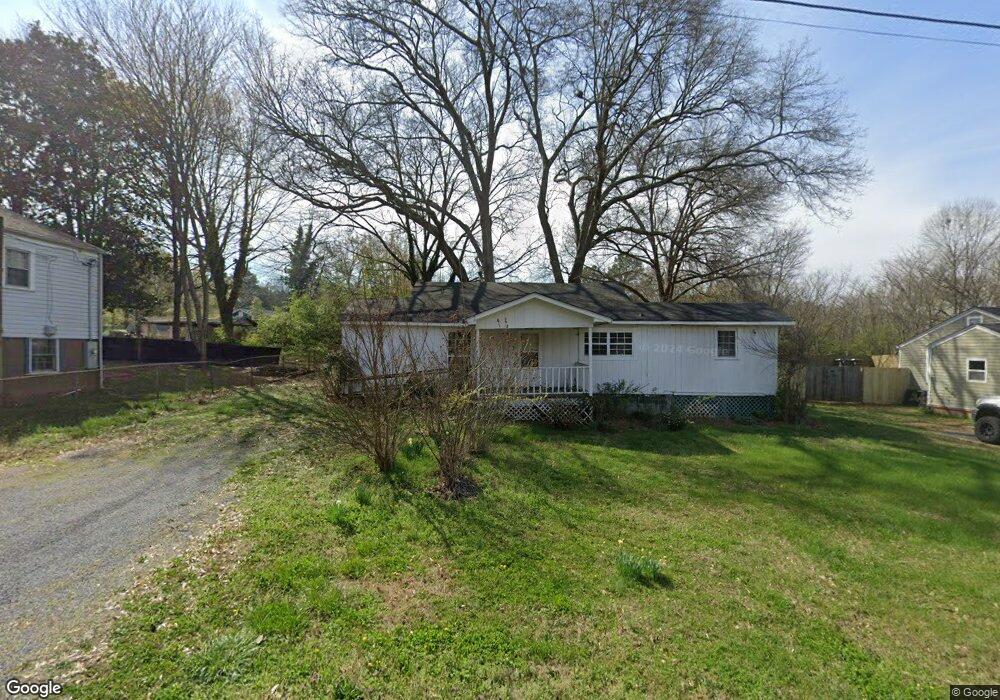
About This Home
This home is located at 2 W Linden St SE, Rome, GA 30161 and is currently estimated at $98,808, approximately $109 per square foot. 2 W Linden St SE is a home located in Floyd County with nearby schools including Pepperell Middle School, Pepperell High School, and Montessori School of Rome.
Ownership History
Date
Name
Owned For
Owner Type
Purchase Details
Closed on
Aug 22, 2025
Sold by
Shattles David Allen
Bought by
D & I Renovations Llc
Current Estimated Value
Purchase Details
Closed on
Dec 3, 2019
Sold by
Quicken Loans Inc
Bought by
Shattles David Allen and Shattles Pamela Anne
Purchase Details
Closed on
Jul 2, 2019
Sold by
Agan Glenda
Bought by
Quicken Loans Inc
Purchase Details
Closed on
Aug 30, 2000
Sold by
Hartley Margaret Francellia
Bought by
Agan Glenda
Purchase Details
Closed on
Sep 24, 1986
Sold by
Hartley J L Est Hartley J L Est Hartley
Bought by
Hartley Margaret Francellia
Purchase Details
Closed on
Apr 27, 1962
Sold by
Hines Raymond P Sr Hines Raymond P S
Bought by
Hartley J L Est Hartley J L Est Hartley
Purchase Details
Closed on
Jan 1, 1901
Bought by
Hines Raymond P Sr Hines Raymond P
Create a Home Valuation Report for This Property
The Home Valuation Report is an in-depth analysis detailing your home's value as well as a comparison with similar homes in the area
Home Values in the Area
Average Home Value in this Area
Purchase History
| Date | Buyer | Sale Price | Title Company |
|---|---|---|---|
| D & I Renovations Llc | $60,000 | -- | |
| Shattles David Allen | $40,000 | -- | |
| Quicken Loans Inc | $34,839 | -- | |
| Agan Glenda | $62,000 | -- | |
| P | -- | -- | |
| Hartley Margaret Francellia | -- | -- | |
| Hartley J L Est Hartley J L Est Hartley | -- | -- | |
| Hines Raymond P Sr Hines Raymond P | -- | -- |
Source: Public Records
Tax History Compared to Growth
Tax History
| Year | Tax Paid | Tax Assessment Tax Assessment Total Assessment is a certain percentage of the fair market value that is determined by local assessors to be the total taxable value of land and additions on the property. | Land | Improvement |
|---|---|---|---|---|
| 2024 | $1,470 | $47,281 | $8,100 | $39,181 |
| 2023 | $1,353 | $44,774 | $7,200 | $37,574 |
| 2022 | $1,110 | $37,395 | $6,000 | $31,395 |
| 2021 | $1,016 | $33,670 | $6,000 | $27,670 |
| 2020 | $487 | $30,630 | $4,500 | $26,130 |
| 2019 | $431 | $28,401 | $4,500 | $23,901 |
| 2018 | $417 | $26,852 | $4,500 | $22,352 |
| 2017 | $410 | $25,902 | $4,500 | $21,402 |
| 2016 | $402 | $24,593 | $4,480 | $20,113 |
| 2015 | $394 | $24,593 | $4,480 | $20,113 |
| 2014 | $394 | $24,593 | $4,480 | $20,113 |
Source: Public Records
Map
Nearby Homes
- 107 E Linden St SE
- 2501 Maple Rd SE
- 2508 Maple Rd SE
- 2523 Maple Rd SE
- 0 Martha Berry Hwy Unit 7525627
- 0 Martha Berry Hwy Unit 7614774
- 0 Martha Berry Hwy Unit 10563404
- 2108 Maple Ave SW
- 7 Willingham St SW
- 212 Alfred Ave SE
- 211 Alfred Ave SE
- 226 Flora Ave SE
- 2710 Maple Rd SE
- 2014 Maple Ave SW
- 14 Clover St SW
- 36 Saddle Mountain Rd SE
- 111 Hosea St SW
- 2107 Rockmart Rd SE
- 304 E 19th St SW
- 4 W Linden St SE
- 2424 Maple Rd SE
- 2424 1 2 Maple Rd
- 2424 1/2 Maple Rd SE
- 2424 1/2 Maple St
- 2428 Maple Rd SE
- 2428 1/2 Maple Rd SE
- 2420 Maple Rd SE
- 0 Linden St SE Unit 8676658
- 0 Linden St SE Unit 8122045
- E Linden St SE
- 2418 Maple Rd SE
- 2502 Maple Rd SE
- 2425 1/2 Maple Rd SE
- 2425 Maple Rd SE
- 2423 Maple Rd SE
- 2427 Maple Rd SE
- 2506 Maple Rd SE
- 2421 Maple Rd SE
- 2429 Maple Rd SE