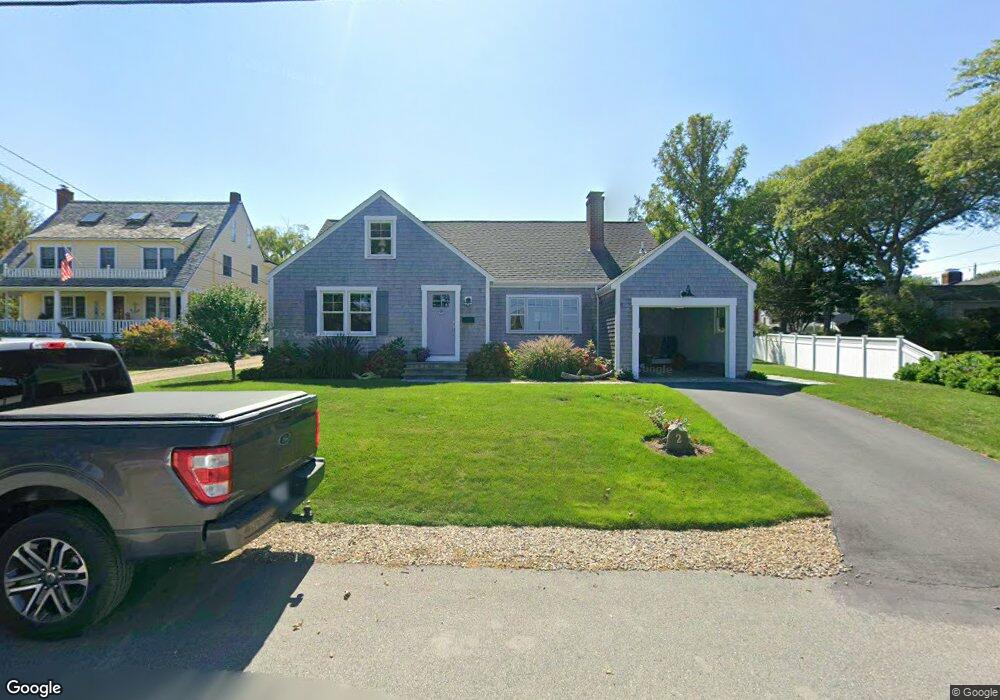
2 Wallace Rd Rockport, MA 01966
Estimated Value: $1,238,459 - $1,702,000
3
Beds
3
Baths
2,588
Sq Ft
$571/Sq Ft
Est. Value
About This Home
This home is located at 2 Wallace Rd, Rockport, MA 01966 and is currently estimated at $1,478,365, approximately $571 per square foot. 2 Wallace Rd is a home located in Essex County with nearby schools including Rockport Elementary School, Rockport Middle School, and Rockport High School.
Ownership History
Date
Name
Owned For
Owner Type
Purchase Details
Closed on
Apr 25, 2012
Sold by
Klinka Brian O and Klinka Vicki J
Bought by
Klinka Ft and Klinka
Current Estimated Value
Purchase Details
Closed on
May 19, 2011
Sold by
Ferri Lawrence D and Ferri Esther S
Bought by
Klinka Brian O and Klinka Vicki J
Home Financials for this Owner
Home Financials are based on the most recent Mortgage that was taken out on this home.
Original Mortgage
$504,000
Interest Rate
4.88%
Mortgage Type
Purchase Money Mortgage
Create a Home Valuation Report for This Property
The Home Valuation Report is an in-depth analysis detailing your home's value as well as a comparison with similar homes in the area
Home Values in the Area
Average Home Value in this Area
Purchase History
| Date | Buyer | Sale Price | Title Company |
|---|---|---|---|
| Klinka Ft | -- | -- | |
| Klinka Ft | -- | -- | |
| Klinka Brian O | $630,000 | -- | |
| Klinka Brian O | $630,000 | -- |
Source: Public Records
Mortgage History
| Date | Status | Borrower | Loan Amount |
|---|---|---|---|
| Previous Owner | Klinka Brian O | $504,000 | |
| Previous Owner | Klinka Brian O | $504,000 |
Source: Public Records
Tax History
| Year | Tax Paid | Tax Assessment Tax Assessment Total Assessment is a certain percentage of the fair market value that is determined by local assessors to be the total taxable value of land and additions on the property. | Land | Improvement |
|---|---|---|---|---|
| 2025 | $8,749 | $998,800 | $490,400 | $508,400 |
| 2024 | $8,316 | $987,600 | $479,200 | $508,400 |
| 2023 | $7,652 | $811,400 | $401,200 | $410,200 |
| 2022 | $7,830 | $797,400 | $373,600 | $423,800 |
| 2021 | $7,324 | $752,000 | $355,800 | $396,200 |
| 2020 | $8,118 | $803,800 | $400,400 | $403,400 |
| 2019 | $7,478 | $758,400 | $390,800 | $367,600 |
| 2018 | $7,313 | $723,300 | $364,800 | $358,500 |
| 2017 | $7,220 | $640,100 | $330,800 | $309,300 |
| 2016 | $7,313 | $650,000 | $333,000 | $317,000 |
| 2015 | $6,910 | $628,200 | $321,500 | $306,700 |
| 2014 | $6,728 | $597,000 | $298,500 | $298,500 |
Source: Public Records
Map
Nearby Homes
Your Personal Tour Guide
Ask me questions while you tour the home.