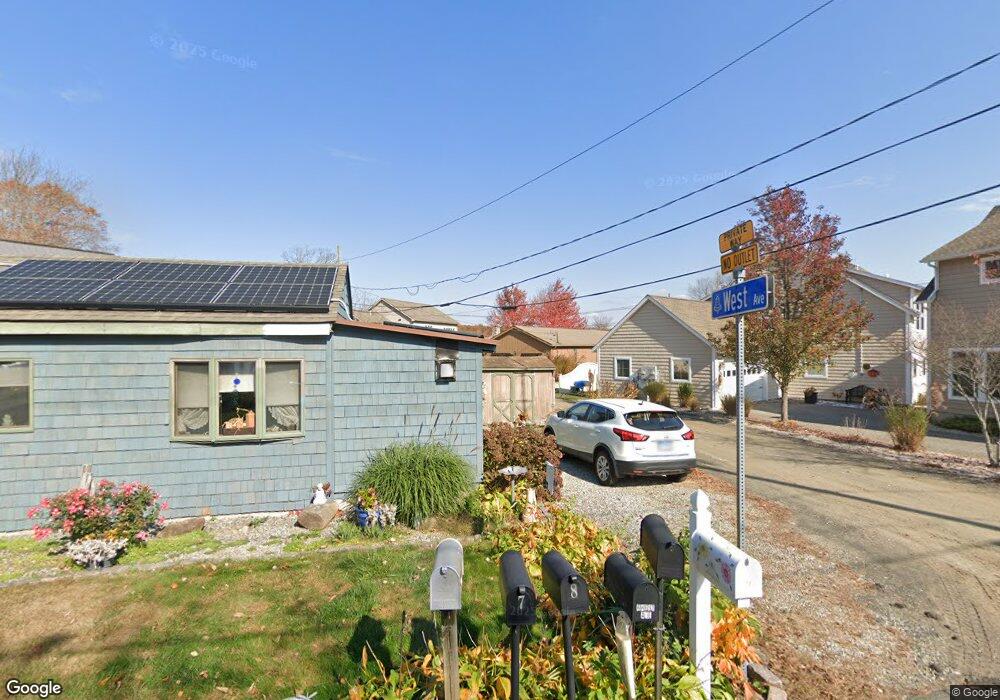
2 West Ct Unit B East Hampton, CT 06424
Estimated Value: $578,842 - $677,000
2
Beds
4
Baths
3,258
Sq Ft
$196/Sq Ft
Est. Value
About This Home
This home is located at 2 West Ct Unit B, East Hampton, CT 06424 and is currently estimated at $638,461, approximately $195 per square foot. 2 West Ct Unit B is a home located in Middlesex County with nearby schools including Memorial School, Center Elementary School, and East Hampton Middle School.
Ownership History
Date
Name
Owned For
Owner Type
Purchase Details
Closed on
Nov 22, 2021
Sold by
Anthony Cv 2 Homeowners
Bought by
Gilmore Hazel M and Gilmore George W
Current Estimated Value
Purchase Details
Closed on
Jul 13, 2019
Sold by
Gagliastri Richard L and Gagliastri Tracy T
Bought by
Shulman David and Shulman Teresa
Create a Home Valuation Report for This Property
The Home Valuation Report is an in-depth analysis detailing your home's value as well as a comparison with similar homes in the area
Home Values in the Area
Average Home Value in this Area
Purchase History
| Date | Buyer | Sale Price | Title Company |
|---|---|---|---|
| Gilmore Hazel M | -- | None Available | |
| Gilmore Hazel M | -- | None Available | |
| Shulman David | $420,000 | None Available | |
| Shulman David | $420,000 | None Available |
Source: Public Records
Tax History
| Year | Tax Paid | Tax Assessment Tax Assessment Total Assessment is a certain percentage of the fair market value that is determined by local assessors to be the total taxable value of land and additions on the property. | Land | Improvement |
|---|---|---|---|---|
| 2025 | $11,147 | $280,720 | $0 | $280,720 |
| 2024 | $10,679 | $280,720 | $0 | $280,720 |
| 2023 | $10,123 | $280,720 | $0 | $280,720 |
| 2022 | $9,730 | $280,720 | $0 | $280,720 |
| 2021 | $9,693 | $280,720 | $0 | $280,720 |
| 2020 | $13,482 | $406,830 | $0 | $406,830 |
| 2019 | $9,895 | $298,590 | $0 | $298,590 |
| 2018 | $9,352 | $298,590 | $0 | $298,590 |
| 2017 | $9,352 | $298,590 | $0 | $298,590 |
| 2016 | $8,790 | $298,590 | $0 | $298,590 |
| 2015 | $10,110 | $363,920 | $0 | $363,920 |
| 2014 | $8,796 | $363,920 | $0 | $363,920 |
Source: Public Records
Map
Nearby Homes
Your Personal Tour Guide
Ask me questions while you tour the home.