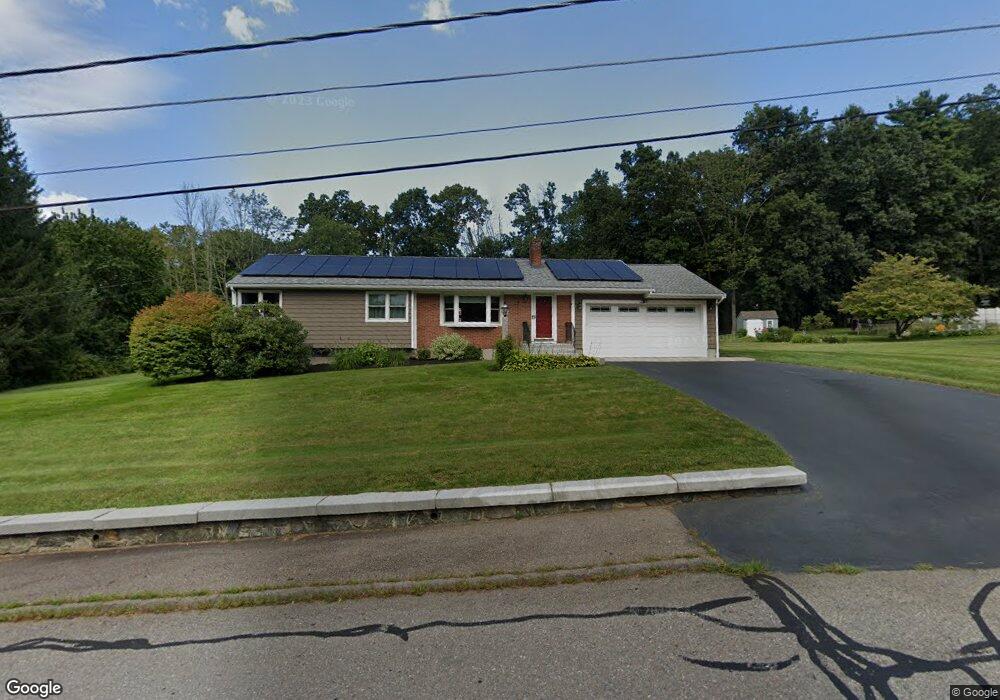
2 Westview Rd Medfield, MA 02052
Estimated Value: $821,000 - $1,018,000
3
Beds
2
Baths
1,556
Sq Ft
$565/Sq Ft
Est. Value
About This Home
This home is located at 2 Westview Rd, Medfield, MA 02052 and is currently estimated at $879,182, approximately $565 per square foot. 2 Westview Rd is a home located in Norfolk County with nearby schools including Ralph Wheelock School, Memorial School, and Dale Street School.
Ownership History
Date
Name
Owned For
Owner Type
Purchase Details
Closed on
Jul 21, 2021
Sold by
Lomax Warry E and Lomax Jane M
Bought by
Lomax Ret and Lomax
Current Estimated Value
Purchase Details
Closed on
Jul 1, 1983
Bought by
Lomax Warry E and Lomax Jane M
Create a Home Valuation Report for This Property
The Home Valuation Report is an in-depth analysis detailing your home's value as well as a comparison with similar homes in the area
Home Values in the Area
Average Home Value in this Area
Purchase History
| Date | Buyer | Sale Price | Title Company |
|---|---|---|---|
| Lomax Ret | -- | None Available | |
| Lomax Ret | -- | None Available | |
| Lomax Warry E | $94,500 | -- |
Source: Public Records
Mortgage History
| Date | Status | Borrower | Loan Amount |
|---|---|---|---|
| Previous Owner | Lomax Warry E | $60,000 |
Source: Public Records
Tax History
| Year | Tax Paid | Tax Assessment Tax Assessment Total Assessment is a certain percentage of the fair market value that is determined by local assessors to be the total taxable value of land and additions on the property. | Land | Improvement |
|---|---|---|---|---|
| 2025 | $10,046 | $728,000 | $491,800 | $236,200 |
| 2024 | $9,780 | $668,000 | $446,600 | $221,400 |
| 2023 | $9,733 | $630,800 | $426,600 | $204,200 |
| 2022 | $9,463 | $543,200 | $406,600 | $136,600 |
| 2021 | $9,187 | $517,300 | $395,600 | $121,700 |
| 2020 | $9,004 | $505,000 | $391,600 | $113,400 |
| 2019 | $8,844 | $494,900 | $385,600 | $109,300 |
| 2018 | $8,050 | $472,700 | $373,600 | $99,100 |
| 2017 | $7,714 | $456,700 | $357,600 | $99,100 |
| 2016 | $7,445 | $444,500 | $347,600 | $96,900 |
| 2015 | $6,424 | $400,500 | $311,500 | $89,000 |
| 2014 | $6,166 | $382,500 | $293,500 | $89,000 |
Source: Public Records
Map
Nearby Homes
- 25 Forest St
- 115 High St
- 14 Onondaga Ln
- The Georgetown L Plan at Lakeland Hills
- The Georgetown Grand L Plan at Lakeland Hills
- The Georgetown R Plan at Lakeland Hills
- The Georgetown Grand R Plan at Lakeland Hills
- 63 Thomas Mann Cir Unit 36
- 53 Thomas Mann Cir Unit 31
- 28 Thomas Mann Cir Unit Lot 38
- 26 Thomas Mann Cir Unit 37
- 51 Thomas Mann Unit 30
- 27 Thomas Mann Cir Unit 18
- 37 Thomas Mann Cir Unit 23
- 111 Elm St
- 465 Lincoln Rd
- 533 Lincoln Rd
- 27 Whichita Rd
- 33 Whichita Rd
- 17 Fairview Rd