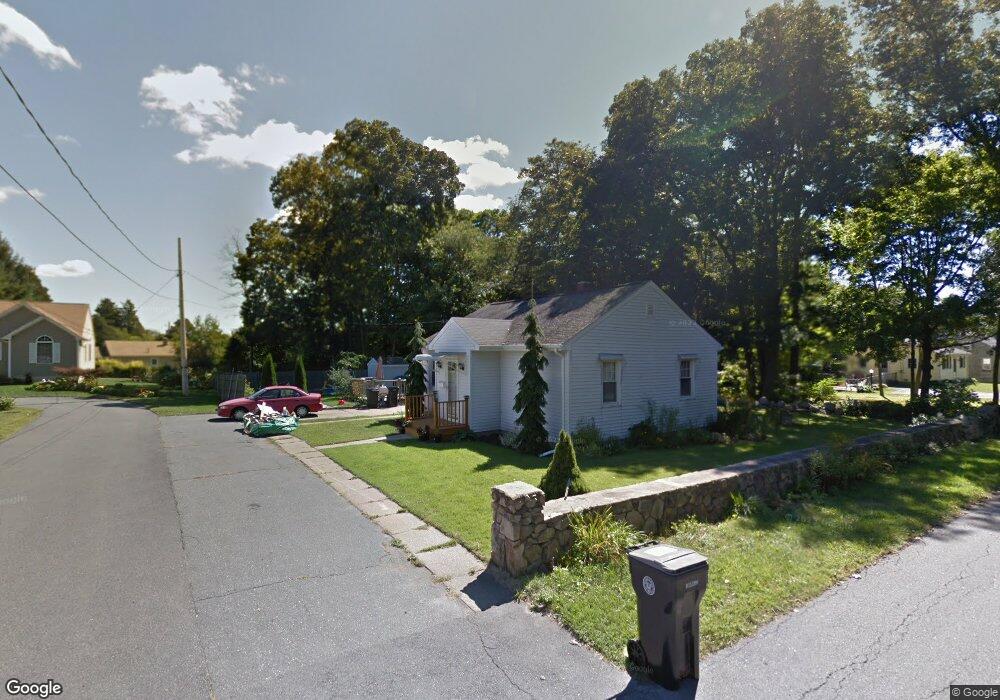
2 Wilbur Ct North Dartmouth, MA 02747
North Dartmouth NeighborhoodEstimated Value: $418,000 - $452,000
2
Beds
1
Bath
800
Sq Ft
$539/Sq Ft
Est. Value
About This Home
This home is located at 2 Wilbur Ct, North Dartmouth, MA 02747 and is currently estimated at $431,323, approximately $539 per square foot. 2 Wilbur Ct is a home located in Bristol County with nearby schools including Dartmouth High School, Nazarene Christian Academy, and Our Sister's School.
Ownership History
Date
Name
Owned For
Owner Type
Purchase Details
Closed on
Feb 14, 2011
Sold by
Beneficial Mass Inc
Bought by
Pedrosa Sergio A
Current Estimated Value
Home Financials for this Owner
Home Financials are based on the most recent Mortgage that was taken out on this home.
Original Mortgage
$146,197
Outstanding Balance
$100,513
Interest Rate
4.88%
Mortgage Type
Purchase Money Mortgage
Estimated Equity
$330,810
Purchase Details
Closed on
Dec 9, 2010
Sold by
Carreiro Ester and Carreiro William G
Bought by
Beneficial Mass Inc
Create a Home Valuation Report for This Property
The Home Valuation Report is an in-depth analysis detailing your home's value as well as a comparison with similar homes in the area
Home Values in the Area
Average Home Value in this Area
Purchase History
| Date | Buyer | Sale Price | Title Company |
|---|---|---|---|
| Pedrosa Sergio A | $150,000 | -- | |
| Beneficial Mass Inc | $123,337 | -- |
Source: Public Records
Mortgage History
| Date | Status | Borrower | Loan Amount |
|---|---|---|---|
| Open | Pedrosa Sergio A | $146,197 | |
| Previous Owner | Beneficial Mass Inc | $36,748 | |
| Previous Owner | Beneficial Mass Inc | $240,991 |
Source: Public Records
Tax History Compared to Growth
Tax History
| Year | Tax Paid | Tax Assessment Tax Assessment Total Assessment is a certain percentage of the fair market value that is determined by local assessors to be the total taxable value of land and additions on the property. | Land | Improvement |
|---|---|---|---|---|
| 2025 | $3,049 | $336,900 | $157,400 | $179,500 |
| 2024 | $2,937 | $321,300 | $150,100 | $171,200 |
| 2023 | $2,848 | $293,900 | $139,200 | $154,700 |
| 2022 | $2,715 | $262,100 | $133,200 | $128,900 |
| 2021 | $2,547 | $235,200 | $117,500 | $117,700 |
| 2020 | $2,502 | $230,000 | $117,500 | $112,500 |
| 2019 | $2,481 | $228,700 | $117,500 | $111,200 |
| 2018 | $2,292 | $216,000 | $117,500 | $98,500 |
| 2017 | $2,210 | $207,700 | $110,800 | $96,900 |
| 2016 | $2,134 | $201,700 | $110,800 | $90,900 |
| 2015 | $2,058 | $195,800 | $103,600 | $92,200 |
| 2014 | $1,922 | $184,100 | $93,900 | $90,200 |
Source: Public Records
Map
Nearby Homes
- 35 Suffolk Ave
- 0 Middlesex St
- 0 Norfolk Ave Unit 73403282
- 40 Golf St
- 295 Commonwealth Ave
- 968 Geraldine St Unit 1A
- 1 Spring Hill Rd
- 50 Gaywood St
- 805 Hathaway Rd Unit 809
- 35 Jenny Lind St
- 469 Hillman St
- ) Hapwell & Summit St
- 1406 Tucker Rd
- 1338 Rockdale Ave
- 124 Francis St
- 6 Strathmore Rd
- 46 Old Westport Rd
- 245 Brownell St
- 605 Union St
- 0 Victoria St Unit 73457953