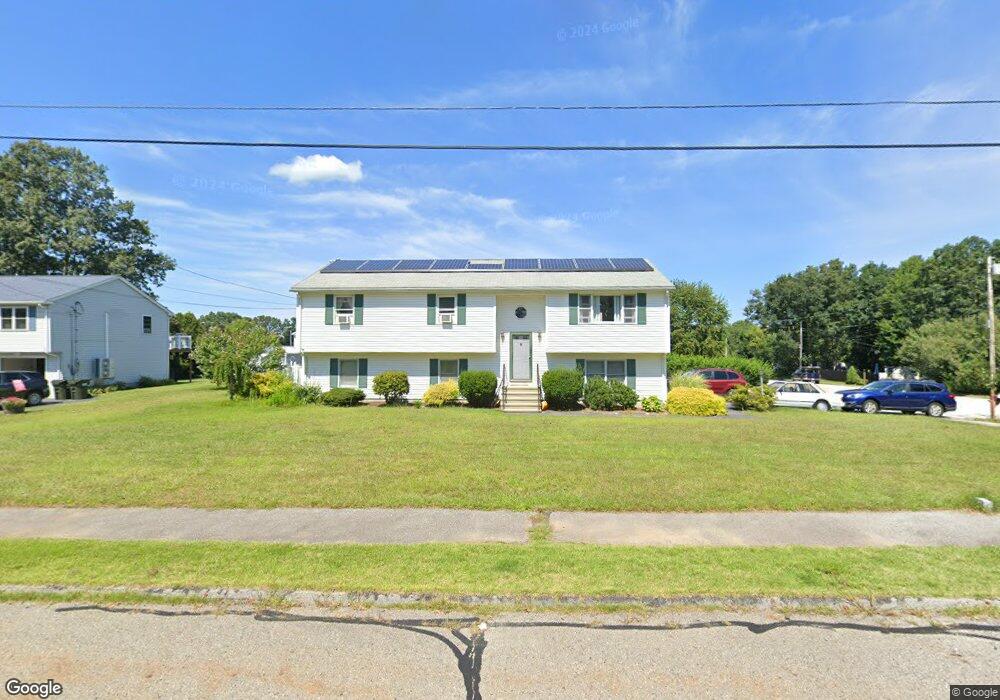
2 Wilfred Ln Webster, MA 01570
Estimated Value: $440,963 - $505,000
3
Beds
2
Baths
1,698
Sq Ft
$277/Sq Ft
Est. Value
About This Home
This home is located at 2 Wilfred Ln, Webster, MA 01570 and is currently estimated at $469,991, approximately $276 per square foot. 2 Wilfred Ln is a home located in Worcester County with nearby schools including Park Avenue Elementary School, Webster Middle School, and Bartlett High School.
Ownership History
Date
Name
Owned For
Owner Type
Purchase Details
Closed on
Sep 27, 2005
Sold by
Chludzinski Alixia A and Chludzinski Richard T
Bought by
Mobley Theresa and Mobley Troy
Current Estimated Value
Home Financials for this Owner
Home Financials are based on the most recent Mortgage that was taken out on this home.
Original Mortgage
$277,400
Outstanding Balance
$149,971
Interest Rate
5.92%
Mortgage Type
Purchase Money Mortgage
Estimated Equity
$320,020
Purchase Details
Closed on
Aug 6, 2002
Sold by
Tupaj Randall J and Tupaj Patricia A
Bought by
Chludzinski Richard T and Chludzinski Alixia A
Home Financials for this Owner
Home Financials are based on the most recent Mortgage that was taken out on this home.
Original Mortgage
$178,000
Interest Rate
6.64%
Mortgage Type
Purchase Money Mortgage
Purchase Details
Closed on
Mar 20, 1998
Sold by
Ceppetelli Wilfred J and Ceppetelli Marilyn F
Bought by
Tupaj Randall J and Tupaj Patricia A
Create a Home Valuation Report for This Property
The Home Valuation Report is an in-depth analysis detailing your home's value as well as a comparison with similar homes in the area
Home Values in the Area
Average Home Value in this Area
Purchase History
| Date | Buyer | Sale Price | Title Company |
|---|---|---|---|
| Mobley Theresa | $292,000 | -- | |
| Chludzinski Richard T | $222,500 | -- | |
| Tupaj Randall J | $135,300 | -- |
Source: Public Records
Mortgage History
| Date | Status | Borrower | Loan Amount |
|---|---|---|---|
| Open | Mobley Theresa | $277,400 | |
| Previous Owner | Tupaj Randall J | $177,000 | |
| Previous Owner | Tupaj Randall J | $22,000 | |
| Previous Owner | Tupaj Randall J | $178,000 | |
| Previous Owner | Tupaj Randall J | $109,000 |
Source: Public Records
Tax History
| Year | Tax Paid | Tax Assessment Tax Assessment Total Assessment is a certain percentage of the fair market value that is determined by local assessors to be the total taxable value of land and additions on the property. | Land | Improvement |
|---|---|---|---|---|
| 2025 | $4,532 | $381,500 | $60,600 | $320,900 |
| 2024 | $4,469 | $366,900 | $58,200 | $308,700 |
| 2023 | $4,063 | $325,000 | $50,400 | $274,600 |
| 2022 | $3,920 | $280,800 | $49,000 | $231,800 |
| 2021 | $3,902 | $258,400 | $49,000 | $209,400 |
| 2020 | $3,780 | $251,000 | $49,000 | $202,000 |
| 2019 | $3,483 | $227,200 | $49,000 | $178,200 |
| 2018 | $3,300 | $214,400 | $49,000 | $165,400 |
| 2017 | $2,962 | $195,800 | $47,900 | $147,900 |
| 2016 | $2,858 | $188,800 | $47,900 | $140,900 |
| 2015 | $2,642 | $180,000 | $47,000 | $133,000 |
Source: Public Records
Map
Nearby Homes