Estimated Value: $508,468 - $663,000
About This Home
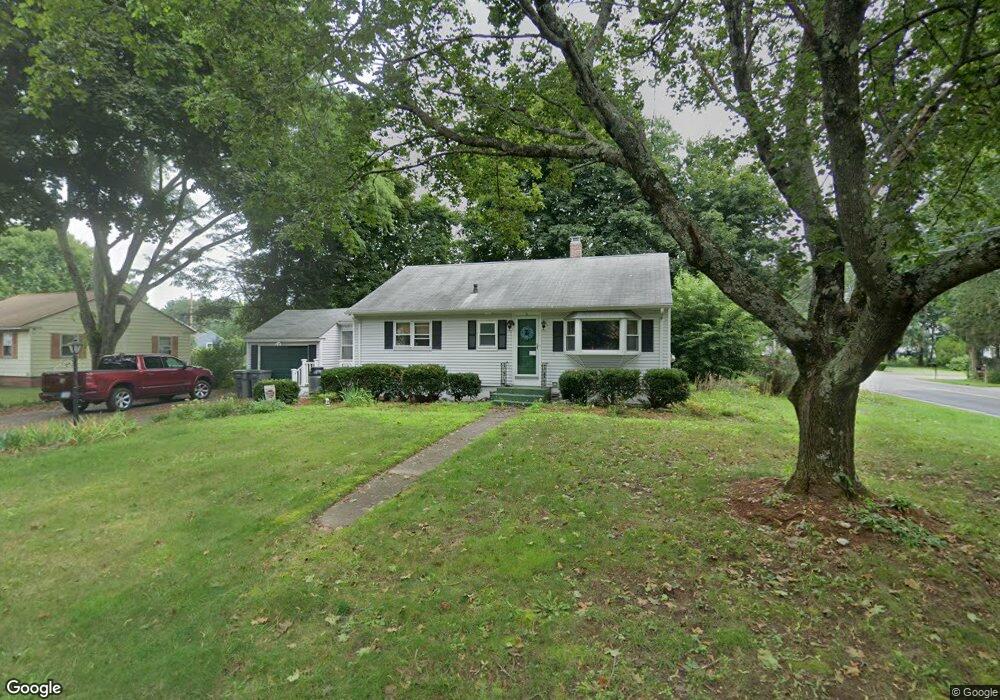
This home is located at 2 Williams St, Salem, NH 03079 and is currently estimated at $561,117, approximately $556 per square foot. 2 Williams St is a home located in Rockingham County with nearby schools including William T. Barron Elementary School, Woodbury School, and Salem High School.
Ownership History
We collect this data history from publicly available records. To have your information removed, we recommend requesting removal directly through your county’s website.
Purchase Details
Home Financials for this Owner
Home Financials are based on the most recent Mortgage that was taken out on this home.Purchase Details
Home Financials for this Owner
Home Financials are based on the most recent Mortgage that was taken out on this home.Purchase History
We collect this data history from publicly available records. To have your information removed, we recommend requesting removal directly through your county’s website.
| Date | Buyer | Sale Price | Title Company |
|---|---|---|---|
| $295,000 | -- | ||
| $139,900 | -- |
Mortgage History
We collect this data history from publicly available records. To have your information removed, we recommend requesting removal directly through your county’s website.
| Date | Status | Borrower | Loan Amount |
|---|---|---|---|
| Open | $175,200 | ||
| Closed | $200,000 | ||
| Previous Owner | $125,910 |
Tax History
We collect this data history from publicly available records. To have your information removed, we recommend requesting removal directly through your county’s website.
| Year | Tax Paid | Tax Assessment Tax Assessment Total Assessment is a certain percentage of the fair market value that is determined by local assessors to be the total taxable value of land and additions on the property. | Land | Improvement |
|---|---|---|---|---|
| 2025 | $6,416 | $353,300 | $158,500 | $194,800 |
| 2024 | $6,218 | $353,300 | $158,500 | $194,800 |
| 2023 | $5,992 | $353,300 | $158,500 | $194,800 |
| 2022 | $5,670 | $353,300 | $158,500 | $194,800 |
| 2021 | $5,646 | $353,300 | $158,500 | $194,800 |
| 2020 | $5,190 | $235,700 | $113,200 | $122,500 |
| 2019 | $5,181 | $235,700 | $113,200 | $122,500 |
| 2018 | $5,093 | $235,700 | $113,200 | $122,500 |
| 2017 | $4,902 | $235,200 | $113,200 | $122,000 |
| 2016 | $4,805 | $235,200 | $113,200 | $122,000 |
| 2015 | $4,706 | $220,000 | $119,100 | $100,900 |
| 2014 | $4,574 | $220,000 | $119,100 | $100,900 |
| 2013 | $4,501 | $220,000 | $119,100 | $100,900 |
Map
- 20 Garrison Rd
- 6 Cypress St
- 7 Catalpa Rd
- 4 Applewood Ln
- 13 Diamond Ave
- 59 Cluff Rd Unit 42
- 6 Remington
- 8 Old Coach Rd
- 5 Sally Sweets Way Unit 215
- 5 Sally Sweets Way Unit 213
- 6 Messer Ave
- 26 Flintlock Rd
- 11 Brookside Ct
- 7 Brookside Ct
- 4 Brook Rd Unit 8
- 11 Hagop Rd
- 92 Bridge St
- 43 Matthias St
- 8 Lancelot Ct Unit 27
- 11 Balmoral Dr
Ask me questions while you tour the home.