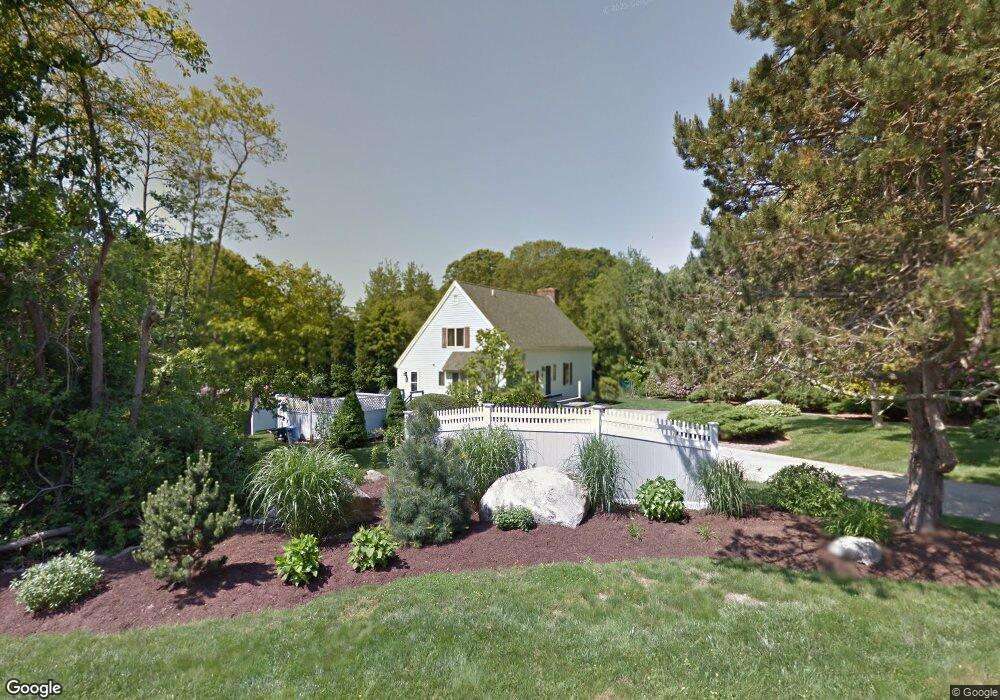
2 Windover Turn Westerly, RI 02891
Estimated Value: $673,010 - $884,000
3
Beds
2
Baths
1,684
Sq Ft
$452/Sq Ft
Est. Value
About This Home
This home is located at 2 Windover Turn, Westerly, RI 02891 and is currently estimated at $760,503, approximately $451 per square foot. 2 Windover Turn is a home located in Washington County with nearby schools including Westerly High School.
Ownership History
Date
Name
Owned For
Owner Type
Purchase Details
Closed on
Aug 24, 2005
Sold by
Brown John and Brown Arlene
Bought by
Cass Richard and Cass Deborah
Current Estimated Value
Purchase Details
Closed on
Jul 25, 1995
Sold by
Winner Naomi L
Bought by
Brown John J and Brown Arlene
Home Financials for this Owner
Home Financials are based on the most recent Mortgage that was taken out on this home.
Original Mortgage
$55,000
Interest Rate
7.49%
Create a Home Valuation Report for This Property
The Home Valuation Report is an in-depth analysis detailing your home's value as well as a comparison with similar homes in the area
Home Values in the Area
Average Home Value in this Area
Purchase History
| Date | Buyer | Sale Price | Title Company |
|---|---|---|---|
| Cass Richard | $425,000 | -- | |
| Brown John J | $165,000 | -- |
Source: Public Records
Mortgage History
| Date | Status | Borrower | Loan Amount |
|---|---|---|---|
| Previous Owner | Brown John J | $270,000 | |
| Previous Owner | Brown John J | $55,000 |
Source: Public Records
Tax History
| Year | Tax Paid | Tax Assessment Tax Assessment Total Assessment is a certain percentage of the fair market value that is determined by local assessors to be the total taxable value of land and additions on the property. | Land | Improvement |
|---|---|---|---|---|
| 2025 | $4,247 | $597,300 | $255,900 | $341,400 |
| 2024 | $4,808 | $490,100 | $183,300 | $306,800 |
| 2023 | $4,715 | $490,100 | $183,300 | $306,800 |
| 2022 | $4,473 | $467,900 | $183,300 | $284,600 |
| 2021 | $4,297 | $373,000 | $159,500 | $213,500 |
| 2020 | $4,219 | $373,000 | $159,500 | $213,500 |
| 2019 | $4,178 | $373,000 | $159,500 | $213,500 |
| 2018 | $4,026 | $338,900 | $147,300 | $191,600 |
| 2017 | $3,928 | $338,900 | $147,300 | $191,600 |
| 2016 | $3,958 | $338,900 | $147,300 | $191,600 |
| 2015 | $3,776 | $349,000 | $162,700 | $186,300 |
| 2014 | $3,696 | $349,000 | $162,700 | $186,300 |
Source: Public Records
Map
Nearby Homes
- 342 Post Rd
- 346 Post Rd
- 5 Robin Hollow Ln
- 35 Robin Hollow Ln
- 43 Noyes Neck Rd
- 6 Verdi Rd
- 30 Clifford Dr
- 26 Charlene Ave
- 22 Breach Dr
- 20 Snowberry Ln
- 13 Plateau Rd
- 5259 Old Post Rd
- 135 Ross Hill Rd
- 143 Ross Hill Rd
- 853 W Beach Rd
- 118 Dunns Corner Rd
- 470 Atlantic Ave
- 446 Atlantic Ave
- 54 Sherwood Dr
- 432 Atlantic Ave
Your Personal Tour Guide
Ask me questions while you tour the home.