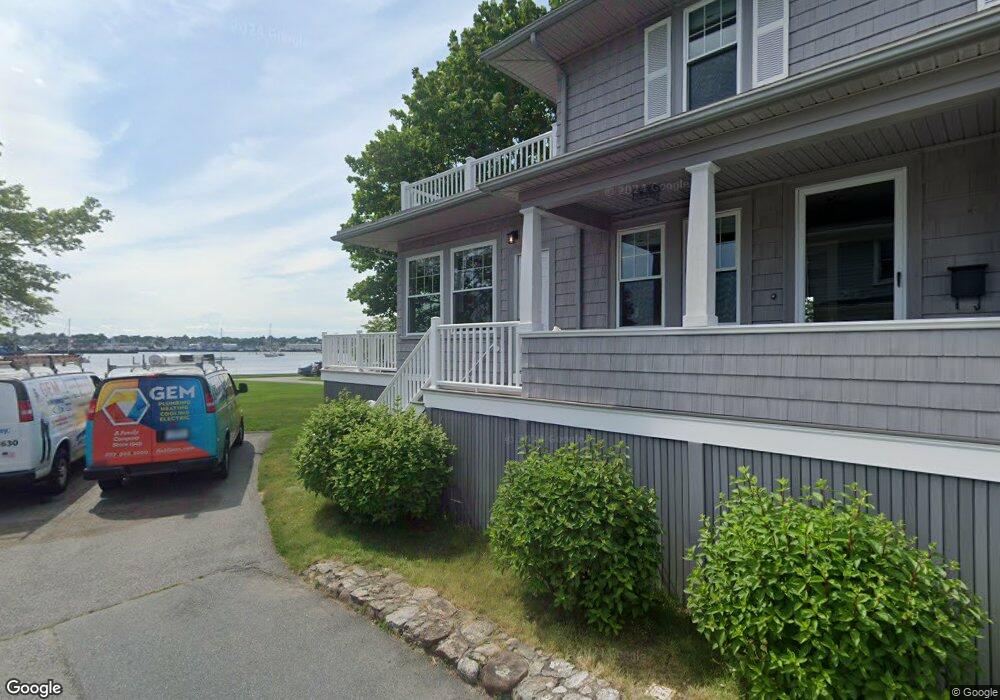
2 Winslow Ct Fairhaven, MA 02719
Oxford NeighborhoodEstimated Value: $543,000 - $884,682
1
Bed
1
Bath
760
Sq Ft
$924/Sq Ft
Est. Value
About This Home
This home is located at 2 Winslow Ct, Fairhaven, MA 02719 and is currently estimated at $702,421, approximately $924 per square foot. 2 Winslow Ct is a home located in Bristol County with nearby schools including Fairhaven High School, City On A Hill Charter Public School New Bedford, and St. Joseph School.
Ownership History
Date
Name
Owned For
Owner Type
Purchase Details
Closed on
Jan 12, 2024
Sold by
Marshall Thomas F and Marshall Kathleen A
Bought by
Thomas F Marshall Lt and Marshall
Current Estimated Value
Purchase Details
Closed on
Oct 8, 2019
Sold by
Marshall Thomas F and Marshall Kathleen A
Bought by
Marshall Kathleen A and Marshall Thomas F
Purchase Details
Closed on
Jan 27, 2012
Sold by
Marshall Kathleen A
Bought by
Marshall Thomas F and Marshqall Kathleen A
Purchase Details
Closed on
Dec 12, 2008
Sold by
1997 Winslow Court Nt and Whitworth
Bought by
1997 Winslow Court Nt and Marshall
Create a Home Valuation Report for This Property
The Home Valuation Report is an in-depth analysis detailing your home's value as well as a comparison with similar homes in the area
Home Values in the Area
Average Home Value in this Area
Purchase History
| Date | Buyer | Sale Price | Title Company |
|---|---|---|---|
| Thomas F Marshall Lt | -- | None Available | |
| Marshall Kathleen A | -- | -- | |
| Marshall Thomas F | -- | -- | |
| 1997 Winslow Court Nt | $195,000 | -- |
Source: Public Records
Tax History Compared to Growth
Tax History
| Year | Tax Paid | Tax Assessment Tax Assessment Total Assessment is a certain percentage of the fair market value that is determined by local assessors to be the total taxable value of land and additions on the property. | Land | Improvement |
|---|---|---|---|---|
| 2025 | $73 | $785,200 | $448,300 | $336,900 |
| 2024 | $6,893 | $746,800 | $426,700 | $320,100 |
| 2023 | $6,335 | $636,700 | $365,900 | $270,800 |
| 2022 | $6,397 | $625,900 | $365,900 | $260,000 |
| 2021 | $6,554 | $580,500 | $351,100 | $229,400 |
| 2020 | $6,420 | $580,500 | $351,100 | $229,400 |
| 2019 | $5,963 | $511,000 | $290,300 | $220,700 |
| 2018 | $5,918 | $497,800 | $290,300 | $207,500 |
| 2017 | $5,829 | $484,100 | $290,300 | $193,800 |
| 2016 | $5,843 | $479,700 | $290,300 | $189,400 |
| 2015 | $5,271 | $433,800 | $263,300 | $170,500 |
Source: Public Records
Map
Nearby Homes