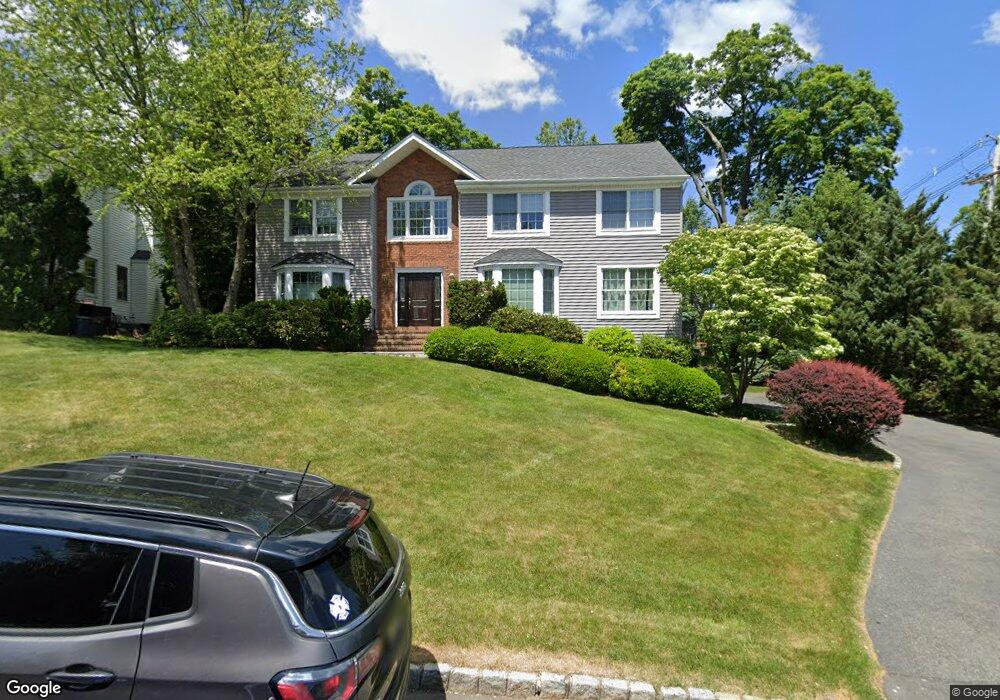
2 Wisteria Ct Madison, NJ 07940
Estimated Value: $1,301,000 - $1,464,000
--
Bed
--
Bath
2,536
Sq Ft
$533/Sq Ft
Est. Value
About This Home
This home is located at 2 Wisteria Ct, Madison, NJ 07940 and is currently estimated at $1,352,754, approximately $533 per square foot. 2 Wisteria Ct is a home located in Morris County with nearby schools including Torey J. Sabatini School, Madison Junior School, and Madison High School.
Ownership History
Date
Name
Owned For
Owner Type
Purchase Details
Closed on
Feb 22, 2000
Sold by
Yancy John S and Yancy Julie K
Bought by
Gupta Anurag and Gupta May G
Current Estimated Value
Home Financials for this Owner
Home Financials are based on the most recent Mortgage that was taken out on this home.
Original Mortgage
$400,800
Interest Rate
7.75%
Purchase Details
Closed on
Aug 15, 1997
Sold by
Reagan Cheryl A and Baton Cheryl A
Bought by
Yancy John S and Yancy Julie K
Home Financials for this Owner
Home Financials are based on the most recent Mortgage that was taken out on this home.
Original Mortgage
$310,000
Interest Rate
6.75%
Purchase Details
Closed on
Jun 17, 1997
Sold by
Reagan Ronald D
Bought by
Reagan Cheryl A and Baton Cheryl A
Home Financials for this Owner
Home Financials are based on the most recent Mortgage that was taken out on this home.
Original Mortgage
$310,000
Interest Rate
6.75%
Create a Home Valuation Report for This Property
The Home Valuation Report is an in-depth analysis detailing your home's value as well as a comparison with similar homes in the area
Home Values in the Area
Average Home Value in this Area
Purchase History
| Date | Buyer | Sale Price | Title Company |
|---|---|---|---|
| Gupta Anurag | $501,100 | Commonwealth Land Title Ins | |
| Yancy John S | $420,000 | Fidelity National Title Ins | |
| Reagan Cheryl A | -- | -- |
Source: Public Records
Mortgage History
| Date | Status | Borrower | Loan Amount |
|---|---|---|---|
| Previous Owner | Gupta Anurag | $400,800 | |
| Previous Owner | Yancy John S | $310,000 |
Source: Public Records
Tax History Compared to Growth
Tax History
| Year | Tax Paid | Tax Assessment Tax Assessment Total Assessment is a certain percentage of the fair market value that is determined by local assessors to be the total taxable value of land and additions on the property. | Land | Improvement |
|---|---|---|---|---|
| 2025 | $17,049 | $800,400 | $365,000 | $435,400 |
| 2024 | $16,480 | $800,400 | $365,000 | $435,400 |
| 2023 | $16,480 | $800,400 | $365,000 | $435,400 |
| 2022 | $16,216 | $800,400 | $365,000 | $435,400 |
| 2021 | $16,216 | $800,400 | $365,000 | $435,400 |
| 2020 | $16,048 | $800,400 | $365,000 | $435,400 |
| 2019 | $15,792 | $800,400 | $365,000 | $435,400 |
| 2018 | $15,392 | $800,400 | $365,000 | $435,400 |
| 2017 | $15,272 | $800,400 | $365,000 | $435,400 |
| 2016 | $15,008 | $800,400 | $365,000 | $435,400 |
| 2015 | $14,727 | $800,400 | $365,000 | $435,400 |
| 2014 | $14,231 | $800,400 | $365,000 | $435,400 |
Source: Public Records
Map
Nearby Homes