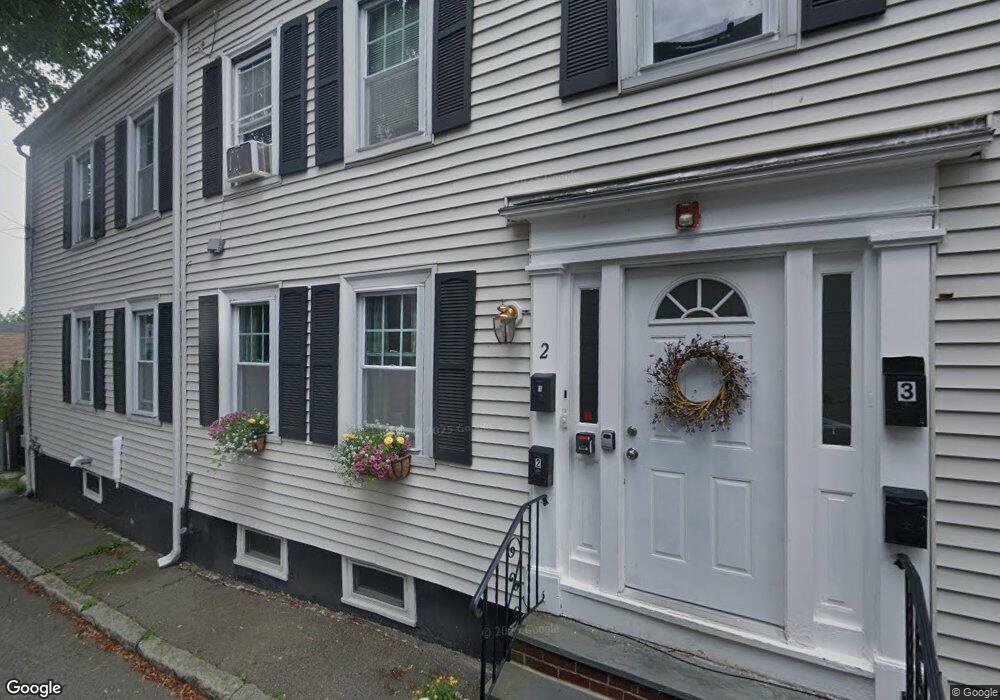
2 Woodbury Ct Unit 1 Salem, MA 01970
Bridge Street NeighborhoodEstimated Value: $328,000 - $435,000
2
Beds
1
Bath
713
Sq Ft
$521/Sq Ft
Est. Value
About This Home
This home is located at 2 Woodbury Ct Unit 1, Salem, MA 01970 and is currently estimated at $371,354, approximately $520 per square foot. 2 Woodbury Ct Unit 1 is a home located in Essex County with nearby schools including Carlton Elementary School, Saltonstall School, and Bates Elementary School.
Ownership History
Date
Name
Owned For
Owner Type
Purchase Details
Closed on
Jun 30, 2020
Sold by
Mcintire Cynthia
Bought by
Disanto Kateri E
Current Estimated Value
Purchase Details
Closed on
Jul 17, 2009
Sold by
Sargent Alison M
Bought by
Mcintre Cynthia M
Home Financials for this Owner
Home Financials are based on the most recent Mortgage that was taken out on this home.
Original Mortgage
$94,700
Interest Rate
5.31%
Mortgage Type
Purchase Money Mortgage
Purchase Details
Closed on
Aug 15, 2005
Sold by
Scott Gary M
Bought by
Sargent Alison M
Home Financials for this Owner
Home Financials are based on the most recent Mortgage that was taken out on this home.
Original Mortgage
$146,000
Interest Rate
5.54%
Mortgage Type
Purchase Money Mortgage
Create a Home Valuation Report for This Property
The Home Valuation Report is an in-depth analysis detailing your home's value as well as a comparison with similar homes in the area
Home Values in the Area
Average Home Value in this Area
Purchase History
| Date | Buyer | Sale Price | Title Company |
|---|---|---|---|
| Disanto Kateri E | -- | None Available | |
| Mcintre Cynthia M | $124,000 | -- | |
| Sargent Alison M | $154,000 | -- |
Source: Public Records
Mortgage History
| Date | Status | Borrower | Loan Amount |
|---|---|---|---|
| Previous Owner | Sargent Alison M | $94,700 | |
| Previous Owner | Sargent Alison M | $24,800 | |
| Previous Owner | Sargent Alison M | $146,000 |
Source: Public Records
Tax History Compared to Growth
Tax History
| Year | Tax Paid | Tax Assessment Tax Assessment Total Assessment is a certain percentage of the fair market value that is determined by local assessors to be the total taxable value of land and additions on the property. | Land | Improvement |
|---|---|---|---|---|
| 2025 | $2,946 | $259,800 | $0 | $259,800 |
| 2024 | $2,864 | $246,500 | $0 | $246,500 |
| 2023 | $2,726 | $217,900 | $0 | $217,900 |
| 2022 | $2,631 | $198,600 | $0 | $198,600 |
| 2021 | $2,535 | $183,700 | $0 | $183,700 |
| 2020 | $2,462 | $170,400 | $0 | $170,400 |
| 2019 | $2,372 | $157,100 | $0 | $157,100 |
| 2018 | $2,238 | $145,500 | $0 | $145,500 |
| 2017 | $2,195 | $138,400 | $0 | $138,400 |
| 2016 | $2,094 | $133,600 | $0 | $133,600 |
| 2015 | -- | $126,400 | $0 | $126,400 |
Source: Public Records
Map
Nearby Homes
- 103 Bridge St Unit 2
- 156 Bridge St Unit B
- 16 Williams St
- 26 Winter St
- 14 Lathrop St
- 18 Franklin St Unit 402
- 18 Franklin St Unit 303
- 8 Williams St Unit 2
- 10 Andrew St Unit 2A
- 41 Dearborn St
- 0 Lot 41 Map 10 Unit 73335079
- 0 Lot 61 Map 10 Unit 73335091
- 5 Larchmont Rd Unit 3
- 8 Upham St
- 21 Emerton St Unit 2
- 112 North St
- 47 Federal St
- 3 S Mason St
- 40 Essex St Unit 2
- 15 Lynde St Unit 26
- 2 Woodbury Ct
- 2 Woodbury Ct Unit 2
- 33 Northey St
- 33 Northey St Unit 33
- 29 Northey St
- 29 Northey St Unit 1
- 29 Northey St Unit 2
- 37 Northey St Unit A
- 37 Northey St Unit B
- 4 Woodbury Ct
- 41 Northey St Unit B
- 35 Northey St Unit A
- 35 Northey St Unit B
- 27 Northey St Unit 2
- 27 Northey St Unit 1
- 27 Northey St
- 39 Northey St Unit A
- 39 Northey St
- 32 Northey St Unit 34
- 36 Northey St