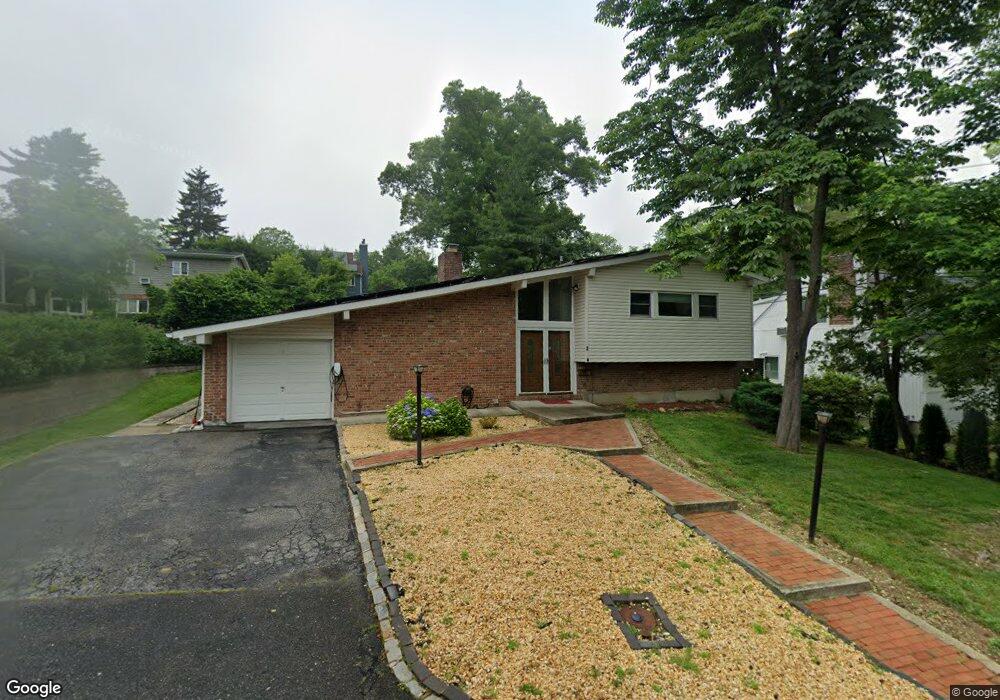
2 York Dr Great Neck, NY 11021
Estimated Value: $1,173,000 - $1,430,891
3
Beds
3
Baths
2,461
Sq Ft
$529/Sq Ft
Est. Value
About This Home
This home is located at 2 York Dr, Great Neck, NY 11021 and is currently estimated at $1,301,946, approximately $529 per square foot. 2 York Dr is a home located in Nassau County with nearby schools including Elizabeth M. Baker Elementary School, Great Neck South Middle School, and Richard S. Sherman - Great Neck North Middle School.
Ownership History
Date
Name
Owned For
Owner Type
Purchase Details
Closed on
Jul 18, 2025
Sold by
Ian Kue Kyung
Bought by
Lee Sangyoung and Im Eun Kyung
Current Estimated Value
Purchase Details
Closed on
Jun 5, 2020
Sold by
Lee Sangyong and Im Eun Kyung
Bought by
Im Eun Kyung
Purchase Details
Closed on
Oct 14, 2016
Sold by
Danesh Doris and Danesh Babak
Bought by
Lee Sangyong and Im Eun Kyung
Home Financials for this Owner
Home Financials are based on the most recent Mortgage that was taken out on this home.
Original Mortgage
$470,000
Interest Rate
5.37%
Mortgage Type
Adjustable Rate Mortgage/ARM
Purchase Details
Closed on
Nov 20, 2006
Sold by
Feinsilver Mildred
Bought by
Danesh Babak
Create a Home Valuation Report for This Property
The Home Valuation Report is an in-depth analysis detailing your home's value as well as a comparison with similar homes in the area
Home Values in the Area
Average Home Value in this Area
Purchase History
| Date | Buyer | Sale Price | Title Company |
|---|---|---|---|
| Lee Sangyoung | -- | Accommodation | |
| Im Eun Kyung | -- | Judicial Title | |
| Im Eun Kyung | -- | Judicial Title | |
| Im Eun Kyung | -- | Judicial Title | |
| Lee Sangyong | $868,000 | First American Title Insuran | |
| Lee Sangyong | $868,000 | First American Title Insuran | |
| Lee Sangyong | $868,000 | First American Title Insuran | |
| Danesh Babak | $755,000 | -- | |
| Danesh Babak | $755,000 | -- |
Source: Public Records
Mortgage History
| Date | Status | Borrower | Loan Amount |
|---|---|---|---|
| Previous Owner | Lee Sangyong | $470,000 |
Source: Public Records
Tax History Compared to Growth
Tax History
| Year | Tax Paid | Tax Assessment Tax Assessment Total Assessment is a certain percentage of the fair market value that is determined by local assessors to be the total taxable value of land and additions on the property. | Land | Improvement |
|---|---|---|---|---|
| 2025 | $17,385 | $893 | $486 | $407 |
| 2024 | $5,119 | $893 | $486 | $407 |
| 2023 | $14,851 | $893 | $486 | $407 |
| 2022 | $14,851 | $893 | $486 | $407 |
| 2021 | $14,112 | $902 | $491 | $411 |
| 2020 | $13,572 | $1,200 | $1,187 | $13 |
| 2019 | $12,191 | $1,200 | $1,187 | $13 |
| 2018 | $12,191 | $1,200 | $0 | $0 |
| 2017 | $7,472 | $1,275 | $1,121 | $154 |
| 2016 | $11,597 | $1,350 | $1,049 | $301 |
| 2015 | $4,389 | $1,425 | $1,107 | $318 |
| 2014 | $4,389 | $1,425 | $1,107 | $318 |
| 2013 | $4,491 | $1,528 | $1,187 | $341 |
Source: Public Records
Map
Nearby Homes
- 11 Valley View Rd
- 256 Schenck Ave
- 7 Terrace Dr Unit 3H
- 125 Colonial Rd
- 106 Grandview Ave
- 88 Manor Dr
- 12 Longview Place
- 92 Manor Dr
- 300 Thompson Shore Rd
- 14 Combes Dr
- 195 S Middle Neck Rd Unit 2-L
- 185 S Middle Neck Rd Unit 1G
- 42 Mora Ct
- 200 S Middle Neck Rd Unit J-6
- 87 Arleigh Rd
- 180 S Middle Neck Rd Unit 2-A
- 5-A Second
- 80 Clapham Ave
- 90 Schenck Ave Unit 2L
- 6 4th Rd