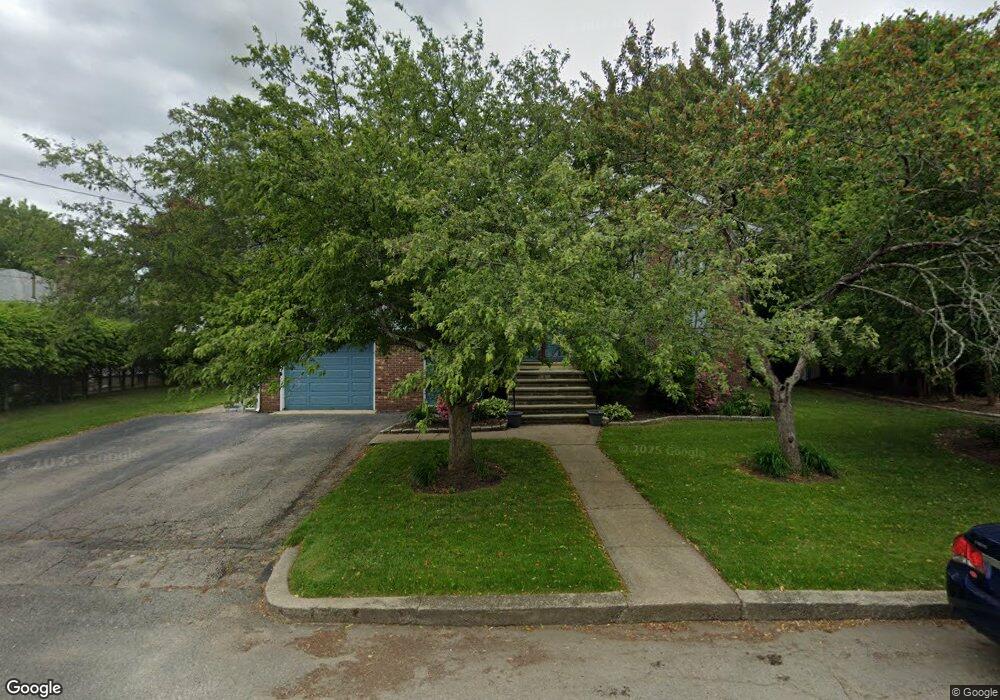
20 1/2 Argonne St Johnston, RI 02919
Hartford Avenue NeighborhoodEstimated Value: $467,000 - $533,337
4
Beds
3
Baths
2,104
Sq Ft
$237/Sq Ft
Est. Value
About This Home
This home is located at 20 1/2 Argonne St, Johnston, RI 02919 and is currently estimated at $497,834, approximately $236 per square foot. 20 1/2 Argonne St is a home located in Providence County with nearby schools including Mazomanie Elementary School, Johnston Senior High School, and Paul Cuffee Charter School.
Ownership History
Date
Name
Owned For
Owner Type
Purchase Details
Closed on
Jul 21, 2021
Sold by
Piccirillo Antonio and Piccirillo Giovannina
Bought by
Piccirillo Antonio
Current Estimated Value
Home Financials for this Owner
Home Financials are based on the most recent Mortgage that was taken out on this home.
Original Mortgage
$74,000
Outstanding Balance
$65,175
Interest Rate
3%
Mortgage Type
Stand Alone Refi Refinance Of Original Loan
Estimated Equity
$432,659
Purchase Details
Closed on
Aug 21, 1984
Bought by
Piccirillo Antonio and Piccirillo Giovanna
Create a Home Valuation Report for This Property
The Home Valuation Report is an in-depth analysis detailing your home's value as well as a comparison with similar homes in the area
Home Values in the Area
Average Home Value in this Area
Purchase History
| Date | Buyer | Sale Price | Title Company |
|---|---|---|---|
| Piccirillo Antonio | -- | None Available | |
| Piccirillo Antonio | -- | None Available | |
| Piccirillo Antonio | -- | -- |
Source: Public Records
Mortgage History
| Date | Status | Borrower | Loan Amount |
|---|---|---|---|
| Open | Piccirillo Antonio | $74,000 |
Source: Public Records
Tax History Compared to Growth
Tax History
| Year | Tax Paid | Tax Assessment Tax Assessment Total Assessment is a certain percentage of the fair market value that is determined by local assessors to be the total taxable value of land and additions on the property. | Land | Improvement |
|---|---|---|---|---|
| 2025 | $6,593 | $422,100 | $89,600 | $332,500 |
| 2024 | $6,458 | $422,100 | $89,600 | $332,500 |
| 2023 | $6,458 | $422,100 | $89,600 | $332,500 |
| 2022 | $6,379 | $274,500 | $68,800 | $205,700 |
| 2021 | $6,379 | $274,500 | $68,800 | $205,700 |
| 2018 | $6,949 | $252,800 | $54,100 | $198,700 |
| 2016 | $9,194 | $252,800 | $54,100 | $198,700 |
| 2015 | $6,668 | $230,000 | $56,500 | $173,500 |
| 2014 | $6,613 | $230,000 | $56,500 | $173,500 |
| 2013 | $6,613 | $230,000 | $56,500 | $173,500 |
Source: Public Records
Map
Nearby Homes
- 6 Flanders St
- 0 Woodbine St
- 1137 Hartford Ave Unit 3A
- 71 Waveland St
- 1141 Hartford Ave Unit 4B
- 46 Auburn Ave
- 19 S Long St
- 13 Ivanhoe St
- 29 Dix Ave
- 0 Eagle St
- 10 S Long St
- 50 Rosemont Ave
- 16 Homestead Ave
- 12 Oakland Ave
- 91 Clifton St
- 11 Traver Ave Unit 1
- 2 Fairmount Ave
- 23 Columbus Ave
- 0 Jackson Ave
- 35 Hedley Ave