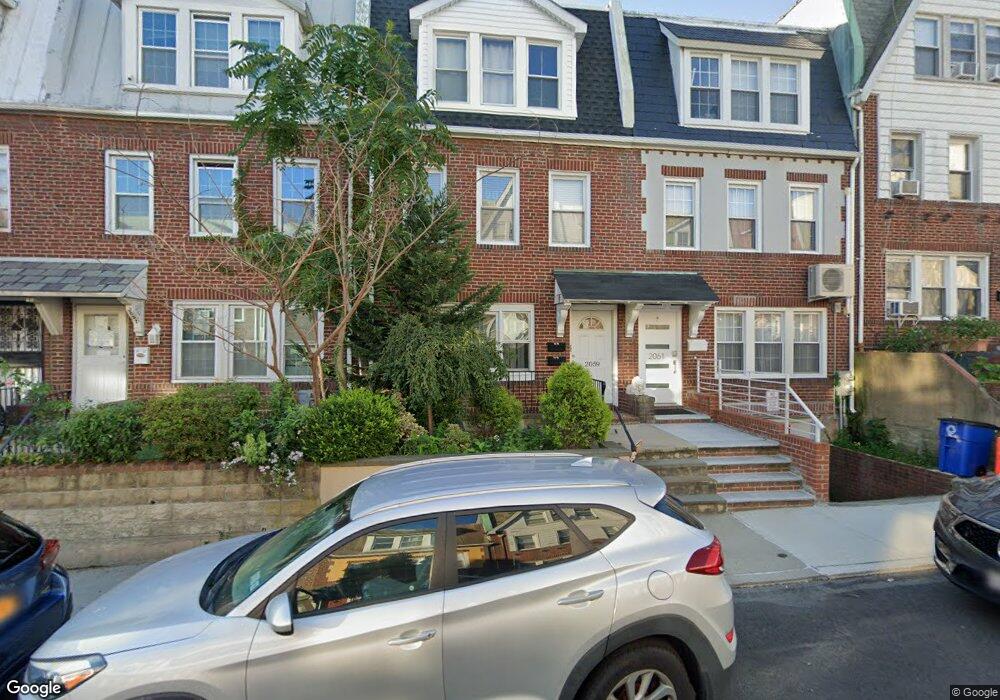
20-59 32nd St Unit 1 Astoria, NY 11105
Ditmars Steinway NeighborhoodEstimated Value: $1,116,981 - $1,468,000
3
Beds
2
Baths
1,728
Sq Ft
$781/Sq Ft
Est. Value
About This Home
This home is located at 20-59 32nd St Unit 1, Astoria, NY 11105 and is currently estimated at $1,349,745, approximately $781 per square foot. 20-59 32nd St Unit 1 is a home located in Queens County with nearby schools including P.S. 85 Judge Charles Vallone, Is 141 The Steinway, and Long Island City High School.
Ownership History
Date
Name
Owned For
Owner Type
Purchase Details
Closed on
May 17, 2019
Sold by
Gisa Realty Corp
Bought by
Suh Jennifer
Current Estimated Value
Home Financials for this Owner
Home Financials are based on the most recent Mortgage that was taken out on this home.
Original Mortgage
$1,050,000
Outstanding Balance
$921,287
Interest Rate
4.1%
Mortgage Type
Purchase Money Mortgage
Estimated Equity
$428,458
Purchase Details
Closed on
Apr 18, 2018
Sold by
Slds 32 Llc and % : Evangelos Mihos Esq
Bought by
Gisa Realty Corp
Home Financials for this Owner
Home Financials are based on the most recent Mortgage that was taken out on this home.
Original Mortgage
$575,000
Interest Rate
4.44%
Mortgage Type
Purchase Money Mortgage
Purchase Details
Closed on
Nov 29, 2017
Sold by
Christina Kokkinos As Life Estate Tenant and Coyle Helen
Bought by
Slds 32 Llc
Create a Home Valuation Report for This Property
The Home Valuation Report is an in-depth analysis detailing your home's value as well as a comparison with similar homes in the area
Home Values in the Area
Average Home Value in this Area
Purchase History
| Date | Buyer | Sale Price | Title Company |
|---|---|---|---|
| Suh Jennifer | $1,400,000 | -- | |
| Gisa Realty Corp | $750,000 | -- | |
| Slds 32 Llc | $725,000 | -- |
Source: Public Records
Mortgage History
| Date | Status | Borrower | Loan Amount |
|---|---|---|---|
| Open | Suh Jennifer | $1,050,000 | |
| Previous Owner | Gisa Realty Corp | $575,000 |
Source: Public Records
Tax History Compared to Growth
Tax History
| Year | Tax Paid | Tax Assessment Tax Assessment Total Assessment is a certain percentage of the fair market value that is determined by local assessors to be the total taxable value of land and additions on the property. | Land | Improvement |
|---|---|---|---|---|
| 2025 | $8,755 | $45,984 | $6,738 | $39,246 |
| 2024 | $8,755 | $43,592 | $6,041 | $37,551 |
| 2023 | $8,755 | $43,592 | $6,349 | $37,243 |
| 2022 | $8,583 | $83,100 | $11,640 | $71,460 |
| 2021 | $8,548 | $77,820 | $11,640 | $66,180 |
| 2020 | $8,111 | $78,120 | $11,640 | $66,480 |
| 2019 | $7,599 | $69,960 | $11,640 | $58,320 |
| 2018 | $7,405 | $36,327 | $6,550 | $29,777 |
| 2017 | $3,723 | $35,830 | $7,014 | $28,816 |
| 2016 | $6,766 | $35,830 | $7,014 | $28,816 |
| 2015 | $4,077 | $31,933 | $9,728 | $22,205 |
| 2014 | $4,077 | $30,273 | $11,064 | $19,209 |
Source: Public Records
Map
Nearby Homes
- 20-68 33rd St
- 21-05 33 St Unit 5F
- 21-06 35th St Unit 4-E
- 21-06 35th St Unit 3E
- 21-15 33rd St Unit 4E
- 21-15 33 St Unit 4G
- 21-21 31st St Unit 4 E
- 21-05 33rd St Unit 5-D
- 21-05 33rd St Unit 1G
- 21-16 35th St Unit 5-B
- 21-16 35 Unit 1B
- 35-19 21st Ave
- 21-28 35th St Unit 2-A
- 21-37 33rd St Unit 5-B
- 2137 33rd St Unit 3D
- 21-37 33rd St Unit 1E
- 2068 28th St
- 21-38 35 St Unit 1H
- 21-38 35th St Unit 1-B
- 21-47 33rd St Unit 1B
- 2059 32 Nd St
- 20-59 32nd St
- 2059 32nd St
- 20-57 32 Nd St Unit 3
- 20-57 32nd St Unit 3
- 2057 32nd St
- 2057 32nd St Unit 3
- 2061 32nd St
- 20-61 32nd St
- 2055 32nd St
- 2063 32nd St
- 20-65 32 Nd St Unit 2
- 2053 32nd St
- 20-65 32nd St Unit 1
- 20-65 32nd St Unit 2
- 2065 32nd St
- 2067 32nd St
- 2051 32nd St
- 2060 33rd St
- 2062 33rd St