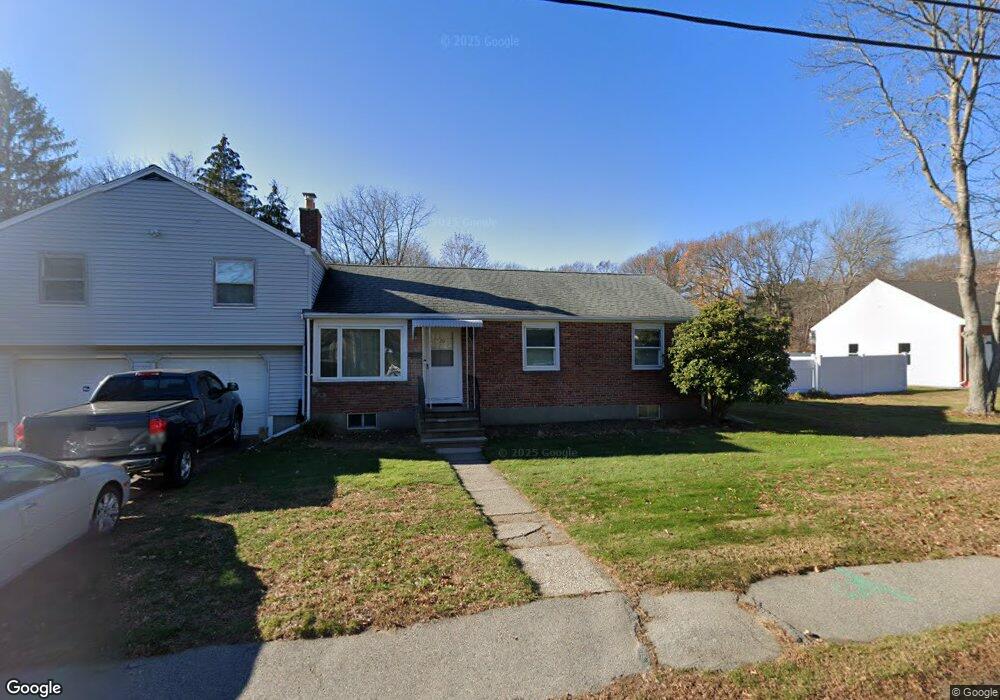
20 Addison St Braintree, MA 02184
North Braintree NeighborhoodEstimated Value: $725,253 - $790,000
5
Beds
2
Baths
1,560
Sq Ft
$480/Sq Ft
Est. Value
About This Home
This home is located at 20 Addison St, Braintree, MA 02184 and is currently estimated at $748,563, approximately $479 per square foot. 20 Addison St is a home located in Norfolk County with nearby schools including Braintree High School, Step Ahead Kindergarten, and Meeting House Montessori School.
Ownership History
Date
Name
Owned For
Owner Type
Purchase Details
Closed on
Feb 12, 2020
Sold by
Lee Benjamin C
Bought by
Lee Benjamin C and Lei Xiao
Current Estimated Value
Purchase Details
Closed on
Nov 30, 2012
Sold by
Dorothy N Juitt Ft and Juitt
Bought by
Lee Benjamin
Home Financials for this Owner
Home Financials are based on the most recent Mortgage that was taken out on this home.
Original Mortgage
$313,500
Interest Rate
3.4%
Mortgage Type
New Conventional
Purchase Details
Closed on
Jan 24, 2012
Sold by
Juitt Dorothy
Bought by
Dorothy N Juitt Ft and Juitt
Purchase Details
Closed on
Apr 20, 2001
Sold by
Mine Brook Corp
Bought by
Merchant Michael and Merchant Carol V
Home Financials for this Owner
Home Financials are based on the most recent Mortgage that was taken out on this home.
Original Mortgage
$356,320
Interest Rate
6.9%
Mortgage Type
Purchase Money Mortgage
Create a Home Valuation Report for This Property
The Home Valuation Report is an in-depth analysis detailing your home's value as well as a comparison with similar homes in the area
Home Values in the Area
Average Home Value in this Area
Purchase History
| Date | Buyer | Sale Price | Title Company |
|---|---|---|---|
| Lee Benjamin C | -- | None Available | |
| Lee Benjamin | $330,000 | -- | |
| Dorothy N Juitt Ft | -- | -- | |
| Juitt Dorothy | -- | -- | |
| Merchant Michael | $145,000 | -- |
Source: Public Records
Mortgage History
| Date | Status | Borrower | Loan Amount |
|---|---|---|---|
| Previous Owner | Lee Benjamin | $313,500 | |
| Previous Owner | Merchant Michael | $20,000 | |
| Previous Owner | Merchant Michael | $356,320 | |
| Previous Owner | Merchant Michael | $15,000 |
Source: Public Records
Tax History
| Year | Tax Paid | Tax Assessment Tax Assessment Total Assessment is a certain percentage of the fair market value that is determined by local assessors to be the total taxable value of land and additions on the property. | Land | Improvement |
|---|---|---|---|---|
| 2025 | $6,206 | $621,800 | $379,600 | $242,200 |
| 2024 | $5,843 | $616,300 | $379,600 | $236,700 |
| 2023 | $5,429 | $556,300 | $333,600 | $222,700 |
| 2022 | $5,192 | $521,800 | $299,100 | $222,700 |
| 2021 | $4,825 | $484,900 | $276,100 | $208,800 |
| 2020 | $4,441 | $450,400 | $241,600 | $208,800 |
| 2019 | $4,086 | $405,000 | $218,600 | $186,400 |
| 2018 | $3,953 | $375,000 | $195,600 | $179,400 |
| 2017 | $3,904 | $363,500 | $184,100 | $179,400 |
| 2016 | $3,818 | $347,700 | $172,600 | $175,100 |
| 2015 | $3,764 | $340,000 | $165,700 | $174,300 |
| 2014 | $3,443 | $301,500 | $149,600 | $151,900 |
Source: Public Records
Map
Nearby Homes
- 7 Del's Way
- 15 Calvin St
- 20 Blossom Rd
- 87 Walnut St
- 18 Royal Lake Dr Unit 3
- 6 Lunar Ave
- 63 Dickerman Ln
- 80 Lake St
- 491 Washington St Unit 1
- 21 Barstow Dr
- 469-471 Washington St
- 6 Franklin St
- 5 Woodsum Dr Unit 12
- 632 Washington St Unit G5
- 145 Hancock St Unit 307
- 145 Hancock St Unit 201
- 44 Shepard Rd
- 12 Howard Ave
- 260 West St Unit 7
- 9 Independence Ave Unit 102
Your Personal Tour Guide
Ask me questions while you tour the home.