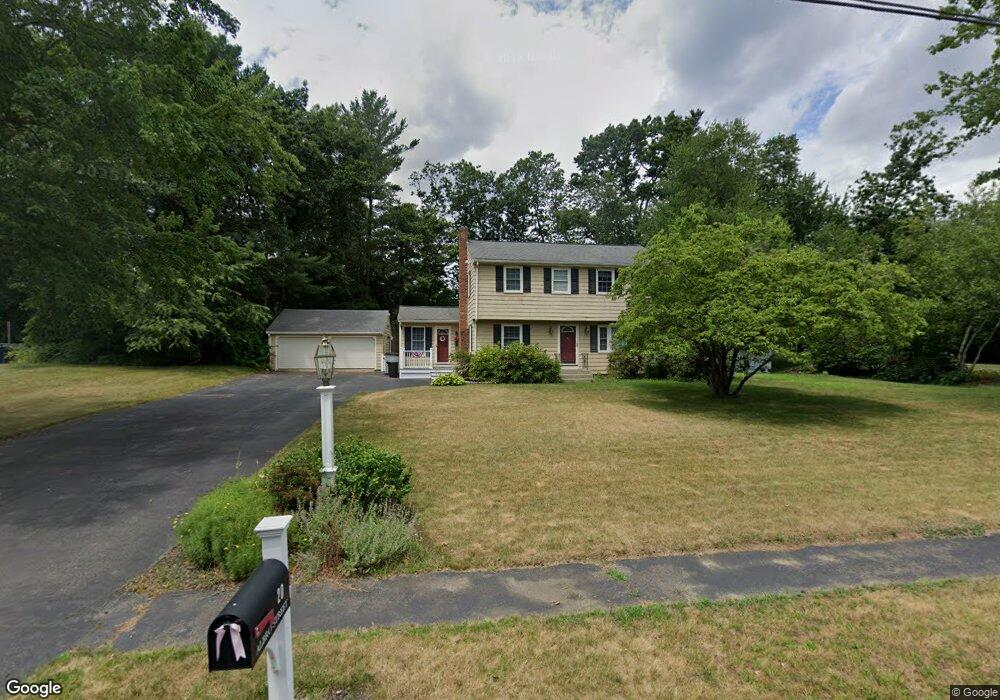
20 Albro St Foxboro, MA 02035
Estimated Value: $726,381 - $796,000
4
Beds
2
Baths
1,952
Sq Ft
$389/Sq Ft
Est. Value
About This Home
This home is located at 20 Albro St, Foxboro, MA 02035 and is currently estimated at $759,595, approximately $389 per square foot. 20 Albro St is a home located in Norfolk County with nearby schools including Foxborough High School, Hands-On-Montessori School, and St Mary's Catholic School.
Ownership History
Date
Name
Owned For
Owner Type
Purchase Details
Closed on
Oct 30, 1992
Sold by
Heacock Eugene A and Heacock Sandra L
Bought by
Mcneil James C
Current Estimated Value
Home Financials for this Owner
Home Financials are based on the most recent Mortgage that was taken out on this home.
Original Mortgage
$161,550
Interest Rate
7.85%
Mortgage Type
Purchase Money Mortgage
Create a Home Valuation Report for This Property
The Home Valuation Report is an in-depth analysis detailing your home's value as well as a comparison with similar homes in the area
Home Values in the Area
Average Home Value in this Area
Purchase History
| Date | Buyer | Sale Price | Title Company |
|---|---|---|---|
| Mcneil James C | $179,500 | -- |
Source: Public Records
Mortgage History
| Date | Status | Borrower | Loan Amount |
|---|---|---|---|
| Open | Mcneil James C | $186,000 | |
| Closed | Mcneil James C | $160,000 | |
| Closed | Mcneil James C | $161,550 |
Source: Public Records
Tax History Compared to Growth
Tax History
| Year | Tax Paid | Tax Assessment Tax Assessment Total Assessment is a certain percentage of the fair market value that is determined by local assessors to be the total taxable value of land and additions on the property. | Land | Improvement |
|---|---|---|---|---|
| 2025 | $7,352 | $556,100 | $217,400 | $338,700 |
| 2024 | $7,035 | $520,700 | $217,400 | $303,300 |
| 2023 | $6,814 | $479,500 | $207,000 | $272,500 |
| 2022 | $6,704 | $461,700 | $198,000 | $263,700 |
| 2021 | $6,402 | $434,300 | $180,000 | $254,300 |
| 2020 | $6,205 | $425,900 | $180,000 | $245,900 |
| 2019 | $5,924 | $403,000 | $171,400 | $231,600 |
| 2018 | $5,572 | $396,600 | $171,400 | $225,200 |
| 2017 | $5,572 | $370,500 | $160,200 | $210,300 |
| 2016 | $5,267 | $355,400 | $154,100 | $201,300 |
| 2015 | $5,190 | $341,700 | $130,200 | $211,500 |
| 2014 | $5,022 | $335,000 | $127,600 | $207,400 |
Source: Public Records
Map
Nearby Homes
- 67 Morse St
- 12 Community Way
- 5 Lauren Ln
- 9 Independence Dr Unit 9
- 35 Independence Dr Unit 35
- 124 E Belcher Rd
- 132 Cannon Forge Dr
- 261 East St
- 170 Cannon Forge Dr
- 619 N Main St
- 18 Winter St Unit E
- 11 W Belcher Rd Unit 5
- 60 King St
- 44 Angell St Unit 44
- 28 Angell St
- 25 Winter St
- 84 Cocasset St Unit A6
- 89 Oak St
- 55-57 Pine Needle Ln
- 2 Red Fox Run