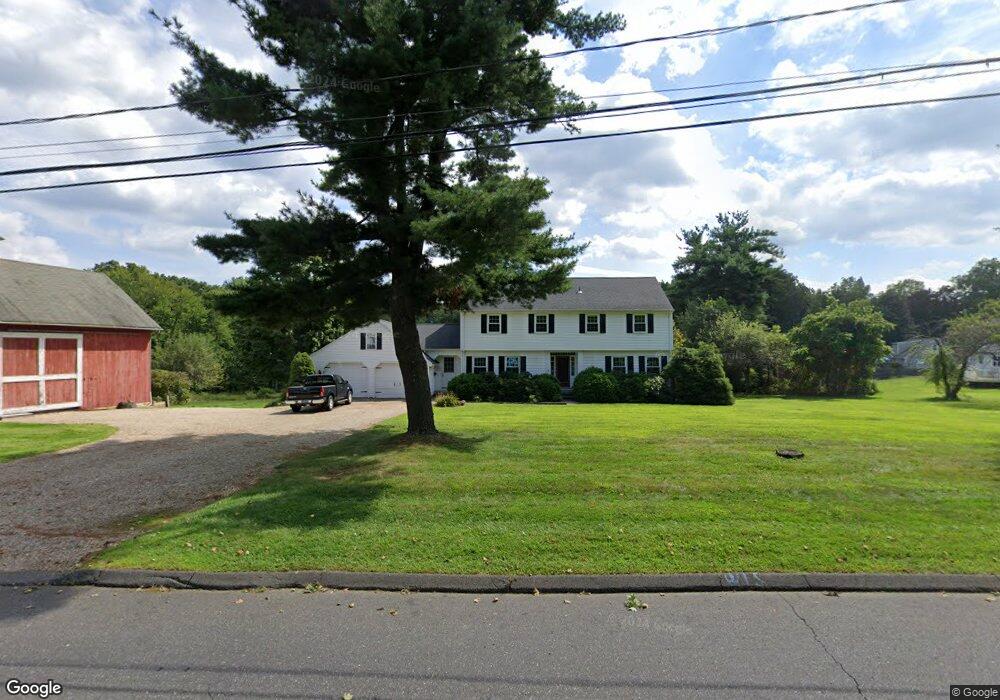
20 Alling St Berlin, CT 06037
Estimated Value: $525,000 - $667,000
4
Beds
3
Baths
2,229
Sq Ft
$265/Sq Ft
Est. Value
About This Home
This home is located at 20 Alling St, Berlin, CT 06037 and is currently estimated at $591,575, approximately $265 per square foot. 20 Alling St is a home located in Hartford County with nearby schools including Mary E. Griswold School, Catherine M. Mcgee Middle School, and Berlin High School.
Ownership History
Date
Name
Owned For
Owner Type
Purchase Details
Closed on
May 2, 2024
Sold by
Carlson Lennart A
Bought by
Carlson William C
Current Estimated Value
Purchase Details
Closed on
Dec 27, 2018
Sold by
Carlson Lennart A and Carlson William
Bought by
Berlin Land T Inc
Purchase Details
Closed on
Jul 12, 2011
Sold by
Carlson Arnold W and Carlson Betty B
Bought by
Carlson Lennart A and Carlson William C
Purchase Details
Closed on
Jan 20, 2011
Sold by
Carlson Arnold W and Carlson Betty B
Bought by
Carlson Arnold W and Carlson Betty B
Home Financials for this Owner
Home Financials are based on the most recent Mortgage that was taken out on this home.
Original Mortgage
$100,000
Interest Rate
4.62%
Purchase Details
Closed on
Jan 20, 2004
Sold by
Carlson Arnold W and Carlson Betty
Bought by
Rossi David J
Create a Home Valuation Report for This Property
The Home Valuation Report is an in-depth analysis detailing your home's value as well as a comparison with similar homes in the area
Home Values in the Area
Average Home Value in this Area
Purchase History
| Date | Buyer | Sale Price | Title Company |
|---|---|---|---|
| Carlson William C | -- | None Available | |
| Carlson William C | -- | None Available | |
| Berlin Land T Inc | -- | -- | |
| Berlin Land T Inc | -- | -- | |
| Carlson Lennart A | $395,000 | -- | |
| Carlson Lennart A | $395,000 | -- | |
| Carlson Arnold W | -- | -- | |
| Carlson Arnold W | -- | -- | |
| Rossi David J | $130,000 | -- | |
| Rossi David J | $130,000 | -- |
Source: Public Records
Mortgage History
| Date | Status | Borrower | Loan Amount |
|---|---|---|---|
| Previous Owner | Rossi David J | $100,000 |
Source: Public Records
Tax History
| Year | Tax Paid | Tax Assessment Tax Assessment Total Assessment is a certain percentage of the fair market value that is determined by local assessors to be the total taxable value of land and additions on the property. | Land | Improvement |
|---|---|---|---|---|
| 2025 | $10,118 | $330,100 | $134,300 | $195,800 |
| 2024 | $9,972 | $330,100 | $134,300 | $195,800 |
| 2023 | $9,758 | $330,100 | $134,300 | $195,800 |
| 2022 | $9,686 | $282,300 | $123,300 | $159,000 |
| 2021 | $9,578 | $282,300 | $123,300 | $159,000 |
| 2020 | $9,578 | $282,300 | $123,300 | $159,000 |
| 2019 | $9,582 | $282,400 | $123,300 | $159,100 |
| 2018 | $9,178 | $282,400 | $123,300 | $159,100 |
| 2017 | $8,680 | $274,600 | $122,600 | $152,000 |
| 2016 | $8,460 | $274,600 | $122,600 | $152,000 |
| 2015 | $8,334 | $274,600 | $122,600 | $152,000 |
| 2014 | $7,921 | $273,900 | $122,600 | $151,300 |
Source: Public Records
Map
Nearby Homes
- 5 Briar Ln
- 10 Main St Unit 107
- 0 Slope South Dr
- 170 Dayl Dr
- 381 Chamberlain Hwy
- 266 Farmington Ave
- 953 High Rd
- 963 High Rd
- 975 High Rd
- 51 Towne Dr
- 28 Glendale Ave
- 33 Langdon Ct Unit D104
- 225 Ox Yoke Dr
- 44 Briar Patch Dr
- 303 New Britain Rd
- 186 Kensington Ave
- 1240 High Rd
- 159 Hartland Terrace
- 243 Pond St
- 152 Lyons St
Your Personal Tour Guide
Ask me questions while you tour the home.