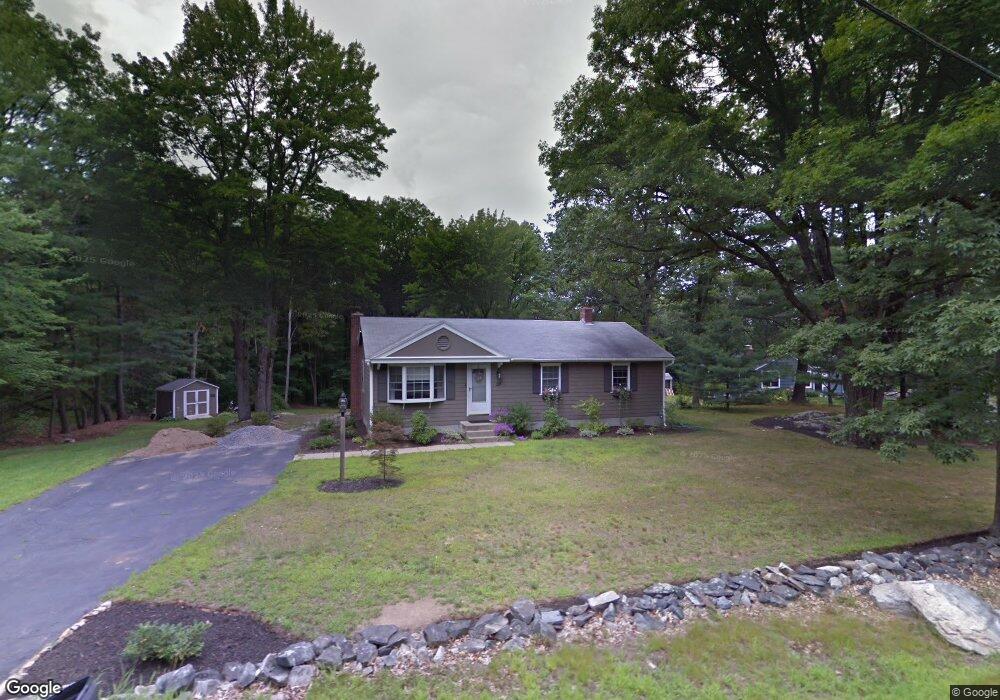
20 Arch St Westborough, MA 01581
Estimated Value: $676,902 - $783,000
3
Beds
2
Baths
1,360
Sq Ft
$531/Sq Ft
Est. Value
About This Home
This home is located at 20 Arch St, Westborough, MA 01581 and is currently estimated at $721,976, approximately $530 per square foot. 20 Arch St is a home located in Worcester County with nearby schools including Westborough High School, Al-Hamra Academy, and Ebridge Montessori School.
Ownership History
Date
Name
Owned For
Owner Type
Purchase Details
Closed on
Jun 4, 2009
Sold by
Murphy Christopher and Griffiths Sian Louise
Bought by
Degrace Chris and Morrell Jaclyn
Current Estimated Value
Home Financials for this Owner
Home Financials are based on the most recent Mortgage that was taken out on this home.
Original Mortgage
$316,560
Interest Rate
4.83%
Mortgage Type
Purchase Money Mortgage
Purchase Details
Closed on
Oct 24, 2003
Sold by
Laplante Christopher and Laplante Heather
Bought by
Murphy Christopher and Griffiths Sian Louise
Purchase Details
Closed on
Apr 20, 2000
Sold by
Leva Robert E and Leva Deborah A
Bought by
Laplante Christopher and Vento Heather
Purchase Details
Closed on
Sep 1, 1999
Sold by
Wrynn Laura A
Bought by
Leva Robert E and Leva Deborah A
Purchase Details
Closed on
Mar 27, 1998
Sold by
Tobin Ann M and Ahlman Diane M
Bought by
Bowman Peter M and Wrynn Laura A
Purchase Details
Closed on
Apr 27, 1990
Sold by
Fitzgerald Richard E
Bought by
Tobin Ann M
Create a Home Valuation Report for This Property
The Home Valuation Report is an in-depth analysis detailing your home's value as well as a comparison with similar homes in the area
Home Values in the Area
Average Home Value in this Area
Purchase History
| Date | Buyer | Sale Price | Title Company |
|---|---|---|---|
| Degrace Chris | $322,400 | -- | |
| Murphy Christopher | $336,500 | -- | |
| Laplante Christopher | $229,900 | -- | |
| Leva Robert E | $212,500 | -- | |
| Bowman Peter M | $170,000 | -- | |
| Tobin Ann M | $145,000 | -- |
Source: Public Records
Mortgage History
| Date | Status | Borrower | Loan Amount |
|---|---|---|---|
| Open | Tobin Ann M | $315,798 | |
| Closed | Degrace Chris | $316,560 |
Source: Public Records
Tax History Compared to Growth
Tax History
| Year | Tax Paid | Tax Assessment Tax Assessment Total Assessment is a certain percentage of the fair market value that is determined by local assessors to be the total taxable value of land and additions on the property. | Land | Improvement |
|---|---|---|---|---|
| 2025 | $9,912 | $608,500 | $340,400 | $268,100 |
| 2024 | $9,885 | $602,400 | $324,000 | $278,400 |
| 2023 | $9,235 | $548,400 | $305,500 | $242,900 |
| 2022 | $8,252 | $446,300 | $254,300 | $192,000 |
| 2021 | $7,475 | $403,200 | $211,200 | $192,000 |
| 2020 | $7,249 | $395,700 | $209,100 | $186,600 |
| 2019 | $6,729 | $367,100 | $219,400 | $147,700 |
| 2018 | $6,083 | $329,500 | $209,100 | $120,400 |
| 2017 | $5,865 | $329,500 | $209,100 | $120,400 |
| 2016 | $5,813 | $327,100 | $205,000 | $122,100 |
| 2015 | $5,856 | $315,000 | $192,700 | $122,300 |
Source: Public Records
Map
Nearby Homes
- 10 Linda St
- 49 Arch St Unit 2
- 64 Arch St
- 71 Nourse St
- 17 Olde Hickory Path
- 457 Walnut St
- 30 Old Nourse St
- 603 South St
- 1 Benjamin Dr
- 165 Green St
- 10 Falcon Dr
- 22 Capt Samuel Forbush Rd
- 562 South St
- 24 Brook St
- 192 W Main St
- 61 Wesson St
- 16 Ward Ln
- 60 Wesson St
- 85 Commons Dr Unit 210
- 65 Commons Dr Unit 502