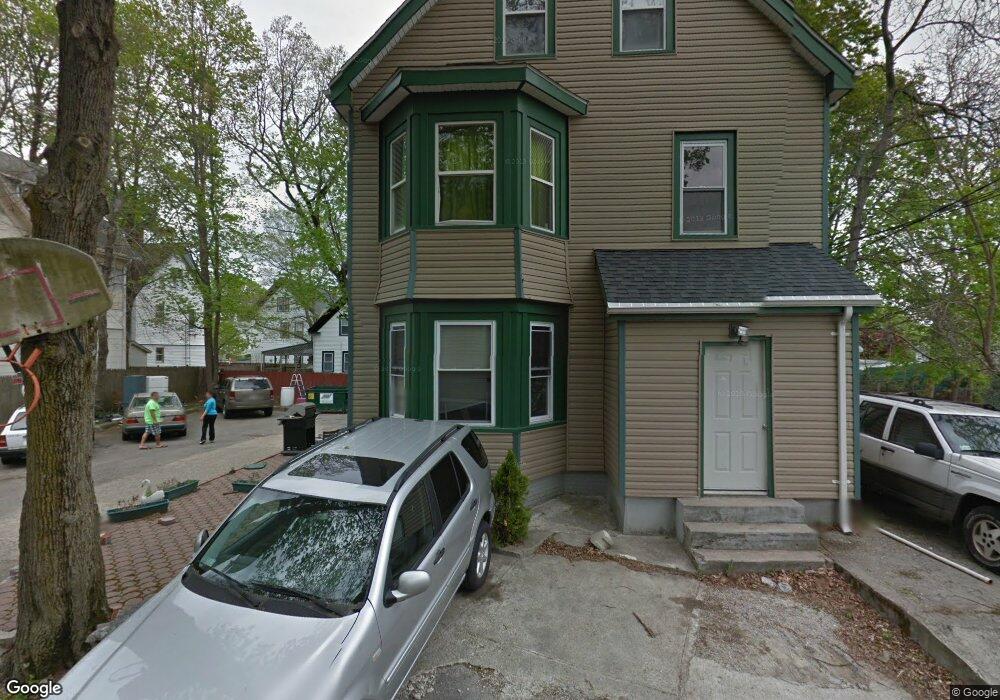
20 Argyle Ave Unit 3 Brockton, MA 02301
Montello NeighborhoodEstimated Value: $660,087 - $867,000
2
Beds
1
Bath
1,250
Sq Ft
$605/Sq Ft
Est. Value
About This Home
This home is located at 20 Argyle Ave Unit 3, Brockton, MA 02301 and is currently estimated at $756,772, approximately $605 per square foot. 20 Argyle Ave Unit 3 is a home located in Plymouth County with nearby schools including Raymond K-8 Elementary School, Louis F Angelo Elementary School, and Manthala George Jr. School.
Ownership History
Date
Name
Owned For
Owner Type
Purchase Details
Closed on
Apr 28, 2006
Sold by
Manuel Serge
Bought by
Anilus Binslas
Current Estimated Value
Home Financials for this Owner
Home Financials are based on the most recent Mortgage that was taken out on this home.
Original Mortgage
$284,000
Interest Rate
6.4%
Mortgage Type
Purchase Money Mortgage
Purchase Details
Closed on
Feb 29, 2000
Sold by
Conley Neil B and Conley Mary B
Bought by
Manuel Serge
Create a Home Valuation Report for This Property
The Home Valuation Report is an in-depth analysis detailing your home's value as well as a comparison with similar homes in the area
Home Values in the Area
Average Home Value in this Area
Purchase History
| Date | Buyer | Sale Price | Title Company |
|---|---|---|---|
| Anilus Binslas | $355,000 | -- | |
| Manuel Serge | $135,000 | -- |
Source: Public Records
Mortgage History
| Date | Status | Borrower | Loan Amount |
|---|---|---|---|
| Open | Manuel Serge | $372,000 | |
| Closed | Manuel Serge | $46,500 | |
| Closed | Manuel Serge | $284,000 |
Source: Public Records
Tax History Compared to Growth
Tax History
| Year | Tax Paid | Tax Assessment Tax Assessment Total Assessment is a certain percentage of the fair market value that is determined by local assessors to be the total taxable value of land and additions on the property. | Land | Improvement |
|---|---|---|---|---|
| 2025 | $8,300 | $685,400 | $136,100 | $549,300 |
| 2024 | $7,998 | $665,400 | $136,100 | $529,300 |
| 2023 | $7,308 | $563,000 | $101,900 | $461,100 |
| 2022 | $7,013 | $502,000 | $92,400 | $409,600 |
| 2021 | $6,938 | $478,500 | $76,400 | $402,100 |
| 2020 | $6,040 | $398,700 | $72,000 | $326,700 |
| 2019 | $5,762 | $370,800 | $69,600 | $301,200 |
| 2018 | $5,438 | $338,600 | $69,600 | $269,000 |
| 2017 | $5,194 | $322,600 | $69,600 | $253,000 |
| 2016 | $4,909 | $282,800 | $67,400 | $215,400 |
| 2015 | $3,501 | $192,900 | $67,400 | $125,500 |
| 2014 | $3,735 | $206,000 | $67,400 | $138,600 |
Source: Public Records
Map
Nearby Homes
- 20 Argyle Ave
- 14 Argyle Ave Unit 3
- 21 Snell St
- 12 Argyle Ave
- 25 Snell St
- 13 Snell St
- 13 Snell St Unit 13 Snell st
- 33 Snell St
- 23 Snell St
- 17 Snell St
- 863 N Main St
- 863 N Main St Unit 1
- 37 Snell St
- 39 Snell St
- 885 N Main St
- 56 Howard St
- 56 Howard St Unit 1
- 56 Howard St Unit 3
- 56 Howard St Unit 2
- 22 Snell St