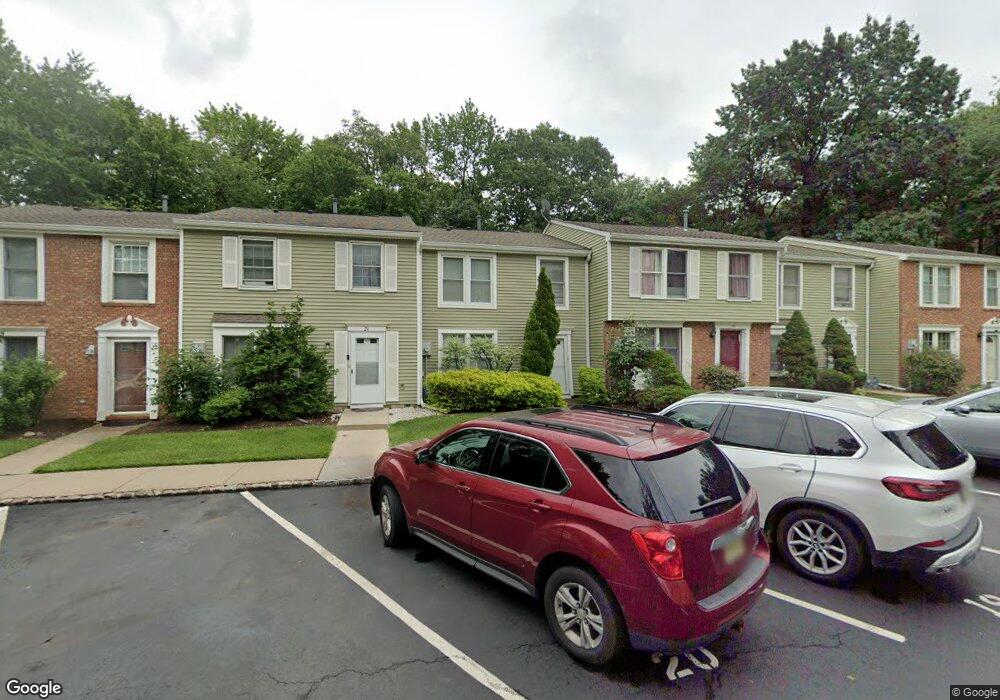
20 Aspen Ct Monmouth Junction, NJ 08852
Estimated Value: $394,237 - $423,000
3
Beds
3
Baths
1,280
Sq Ft
$315/Sq Ft
Est. Value
About This Home
This home is located at 20 Aspen Ct, Monmouth Junction, NJ 08852 and is currently estimated at $403,309, approximately $315 per square foot. 20 Aspen Ct is a home located in Middlesex County with nearby schools including Constable Elementary School, Crossroads North Middle School, and South Brunswick High School.
Ownership History
Date
Name
Owned For
Owner Type
Purchase Details
Closed on
Jan 28, 2021
Sold by
Yeung Lois M and Yeung Luk P
Bought by
Busare Rahinatu
Current Estimated Value
Home Financials for this Owner
Home Financials are based on the most recent Mortgage that was taken out on this home.
Original Mortgage
$217,800
Outstanding Balance
$194,629
Interest Rate
2.65%
Mortgage Type
New Conventional
Estimated Equity
$208,680
Purchase Details
Closed on
Aug 9, 2006
Sold by
Lago Charles Dal
Bought by
Lee Lois and Yeung Luk
Home Financials for this Owner
Home Financials are based on the most recent Mortgage that was taken out on this home.
Original Mortgage
$258,875
Interest Rate
6.8%
Purchase Details
Closed on
Oct 22, 1999
Sold by
Denapoli Ralph
Bought by
Lago Charles Dal
Create a Home Valuation Report for This Property
The Home Valuation Report is an in-depth analysis detailing your home's value as well as a comparison with similar homes in the area
Home Values in the Area
Average Home Value in this Area
Purchase History
| Date | Buyer | Sale Price | Title Company |
|---|---|---|---|
| Busare Rahinatu | $242,000 | Chicago Title Insurance Co | |
| Busare Rahinatu | $242,000 | Chicago Title | |
| Lee Lois | $272,500 | -- | |
| Lago Charles Dal | $112,000 | -- |
Source: Public Records
Mortgage History
| Date | Status | Borrower | Loan Amount |
|---|---|---|---|
| Open | Busare Rahinatu | $217,800 | |
| Closed | Busare Rahinatu | $217,800 | |
| Previous Owner | Lee Lois | $258,875 |
Source: Public Records
Tax History Compared to Growth
Tax History
| Year | Tax Paid | Tax Assessment Tax Assessment Total Assessment is a certain percentage of the fair market value that is determined by local assessors to be the total taxable value of land and additions on the property. | Land | Improvement |
|---|---|---|---|---|
| 2025 | $5,065 | $93,000 | $50,000 | $43,000 |
| 2024 | $4,883 | $93,000 | $50,000 | $43,000 |
| 2023 | $4,883 | $93,000 | $50,000 | $43,000 |
| 2022 | $4,739 | $93,000 | $50,000 | $43,000 |
| 2021 | $3,645 | $93,000 | $50,000 | $43,000 |
| 2020 | $4,765 | $93,000 | $50,000 | $43,000 |
| 2019 | $4,807 | $93,000 | $50,000 | $43,000 |
| 2018 | $4,650 | $93,000 | $50,000 | $43,000 |
| 2017 | $4,643 | $93,000 | $50,000 | $43,000 |
| 2016 | $4,593 | $93,000 | $50,000 | $43,000 |
| 2015 | $4,454 | $93,000 | $50,000 | $43,000 |
| 2014 | $4,382 | $93,000 | $50,000 | $43,000 |
Source: Public Records
Map
Nearby Homes