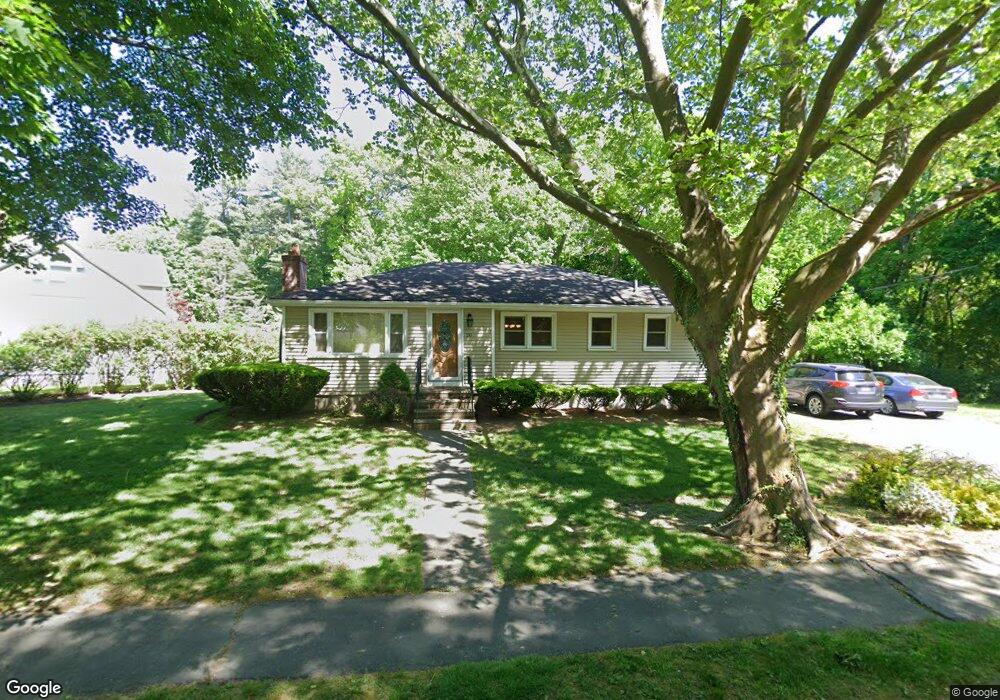
20 Atherton Cir Lynnfield, MA 01940
Estimated Value: $747,874 - $912,000
3
Beds
1
Bath
1,088
Sq Ft
$758/Sq Ft
Est. Value
About This Home
This home is located at 20 Atherton Cir, Lynnfield, MA 01940 and is currently estimated at $824,469, approximately $757 per square foot. 20 Atherton Cir is a home located in Essex County with nearby schools including Pickering Middle School, Lynnfield High School, and Odyssey Day School.
Ownership History
Date
Name
Owned For
Owner Type
Purchase Details
Closed on
Sep 14, 2001
Sold by
Albanese Jennifer S and Albanese Christopher
Bought by
Al Qudah Amer M and Al Qudah Denise A
Current Estimated Value
Purchase Details
Closed on
Feb 24, 1995
Sold by
Bonzani Paul J and Bonzani Lilie
Bought by
Albanese Christopher and Albanese Jennifer
Purchase Details
Closed on
Apr 17, 1991
Sold by
Smith Paul A
Bought by
Bonzani Paul J
Create a Home Valuation Report for This Property
The Home Valuation Report is an in-depth analysis detailing your home's value as well as a comparison with similar homes in the area
Home Values in the Area
Average Home Value in this Area
Purchase History
| Date | Buyer | Sale Price | Title Company |
|---|---|---|---|
| Al Qudah Amer M | $349,900 | -- | |
| Albanese Christopher | $188,750 | -- | |
| Bonzani Paul J | $175,000 | -- |
Source: Public Records
Mortgage History
| Date | Status | Borrower | Loan Amount |
|---|---|---|---|
| Open | Bonzani Paul J | $278,000 | |
| Closed | Bonzani Paul J | $285,000 |
Source: Public Records
Tax History Compared to Growth
Tax History
| Year | Tax Paid | Tax Assessment Tax Assessment Total Assessment is a certain percentage of the fair market value that is determined by local assessors to be the total taxable value of land and additions on the property. | Land | Improvement |
|---|---|---|---|---|
| 2025 | $7,848 | $743,200 | $565,000 | $178,200 |
| 2024 | $7,511 | $714,700 | $543,300 | $171,400 |
| 2023 | $7,608 | $673,300 | $515,300 | $158,000 |
| 2022 | $7,298 | $608,700 | $473,300 | $135,400 |
| 2021 | $6,826 | $514,400 | $385,800 | $128,600 |
| 2020 | $6,601 | $474,200 | $345,600 | $128,600 |
| 2019 | $6,596 | $474,200 | $345,600 | $128,600 |
| 2018 | $6,431 | $467,400 | $345,600 | $121,800 |
| 2017 | $6,271 | $455,100 | $333,300 | $121,800 |
| 2016 | $5,822 | $401,500 | $286,100 | $115,400 |
| 2015 | $5,722 | $394,900 | $285,000 | $109,900 |
Source: Public Records
Map
Nearby Homes